Week 11: Shiny, Part III
Overview
Overview
- AMA
- Tidy evaluation again
- Shiny, Part III
- Best Practices
The Assignment [Multi-week]
A shiny

Syllabus Module for Week 11
A Handy Styling Tool
Another Handy Docker Tool
AMA
Tidy evaluation
Environments and data.

tidy evaluation
The Path Forward
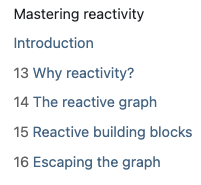
next time
Fun with docker
We will walk through at least one example as time permits.
Docker in brief
docker builddocker push- The Cloud Run Console
This can be tricky with M1 macs as some images do not play nicely. NB: I am just beginning to explore this because it did not occur to me that it would be an issue from my Intel workstation.
Shiny Part III
Working through these chapters
Start with:
library(shiny)
library(dplyr)
ui <- ...
server <- ...
shinyApp(ui, server)
and the steps will fill in a ui and server
Chapter 12
tidyevaluation
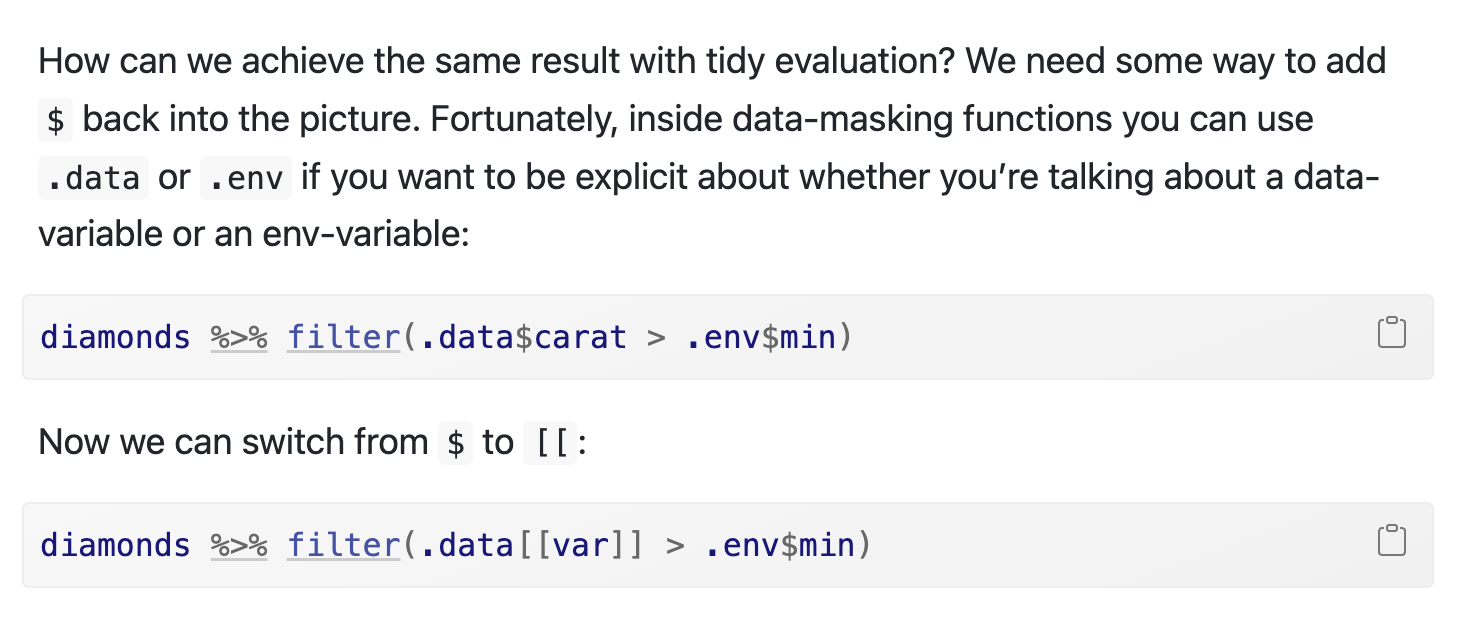
Screen shot
Passing variable names
library(shiny)
library(dplyr)
ui <- fluidPage(
  selectInput("var", "Sort by", choices = names(mtcars)),
  checkboxInput("desc", "Descending order?"),
  tableOutput("data")
)
server <- function(input, output, session) {
  sorted <- reactive({
    if (input$desc) {
      arrange(mtcars, desc(.data[[input$var]]))
    } else {
      arrange(mtcars, .data[[input$var]])
    }
  })
  output$data <- renderTable(sorted())
}
shinyApp(ui, server)
The importance of req. What does it do?

Shot of help
Chapter 13
Why reactivity?
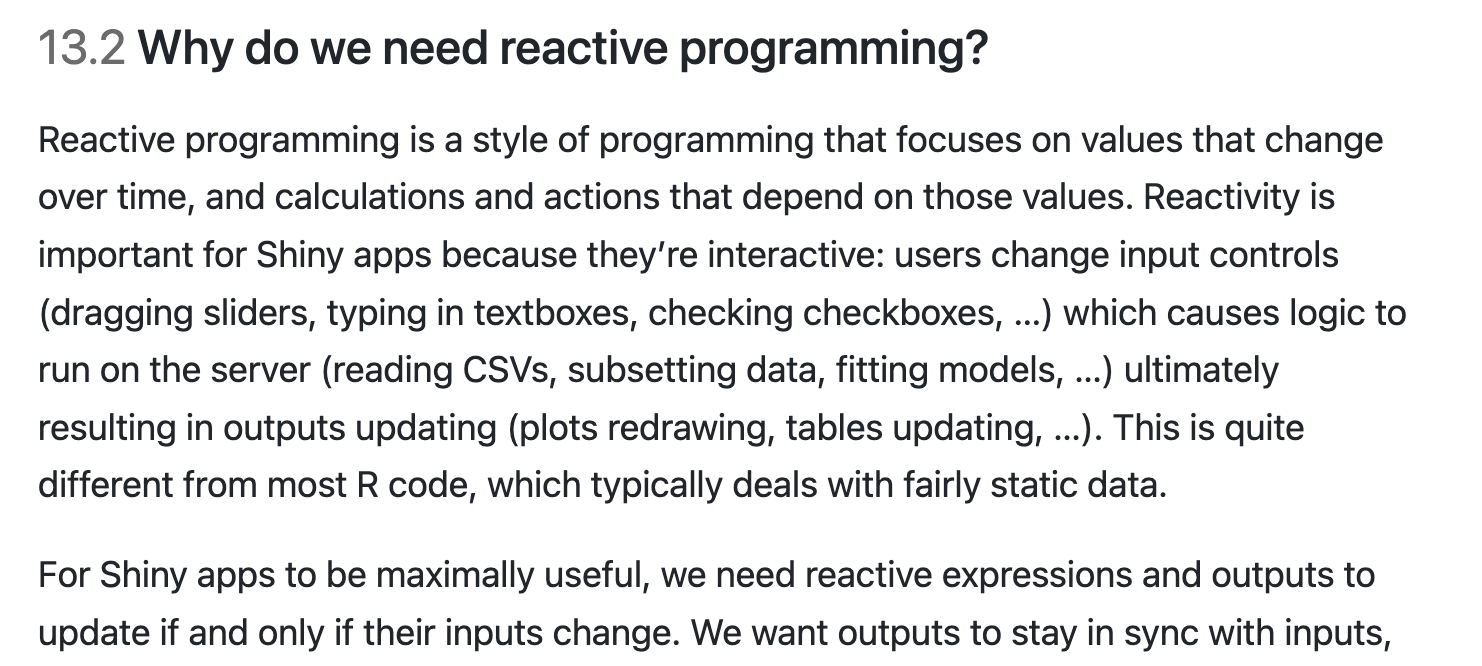
Shot
Playing with Reactive
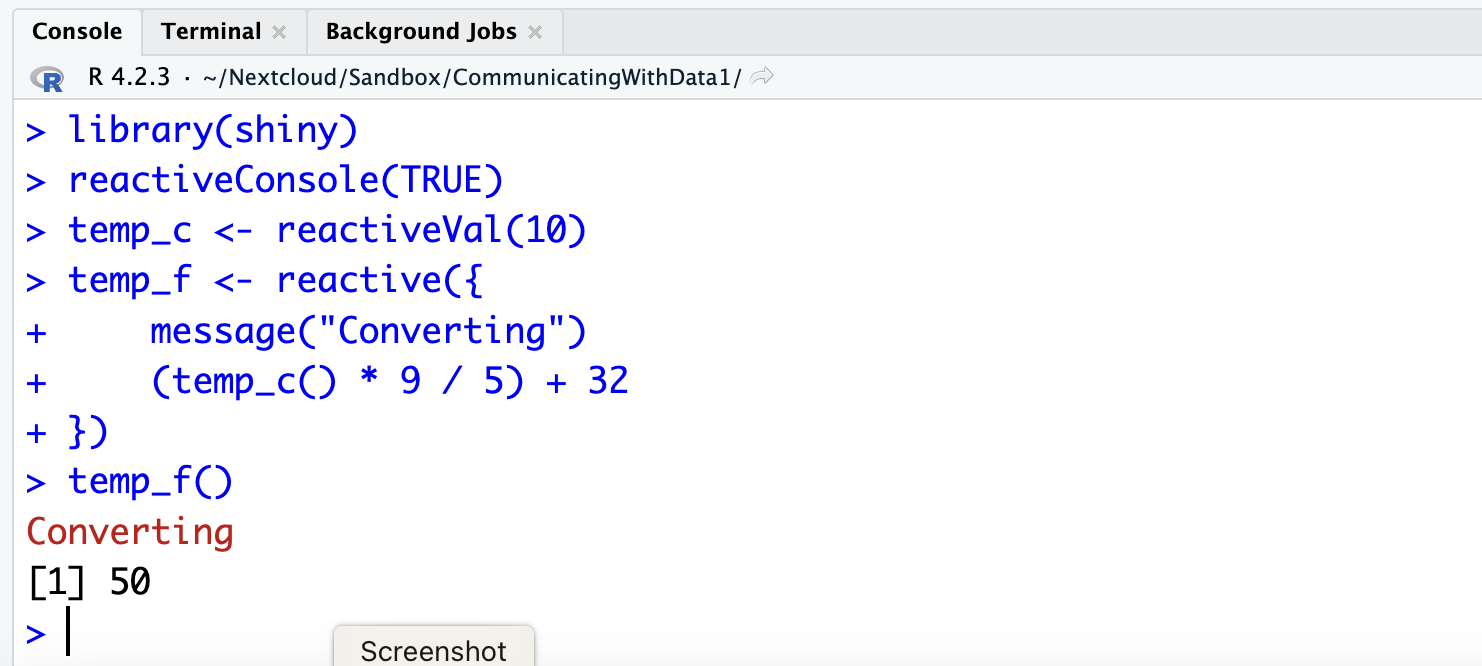
Simple Example
Excel is Reactive, That’s Why It is Popular
It started with VisiCalc…
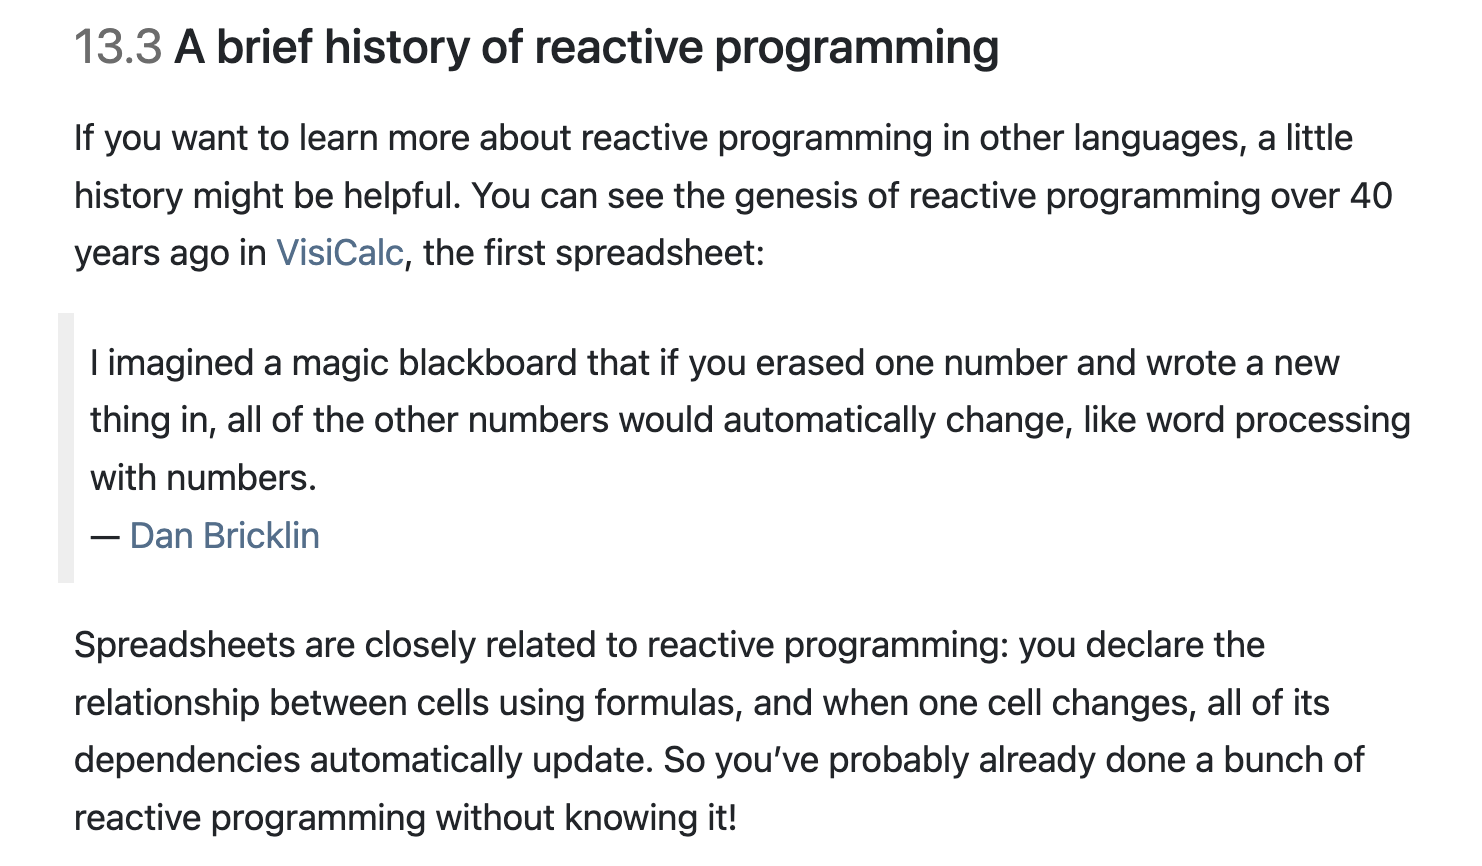
The History
Chapter 14
The reactive graph is worth playing with. Due to modern defaults in RStudio, the workflow is a bit tricky. We will have to run the app in the console.
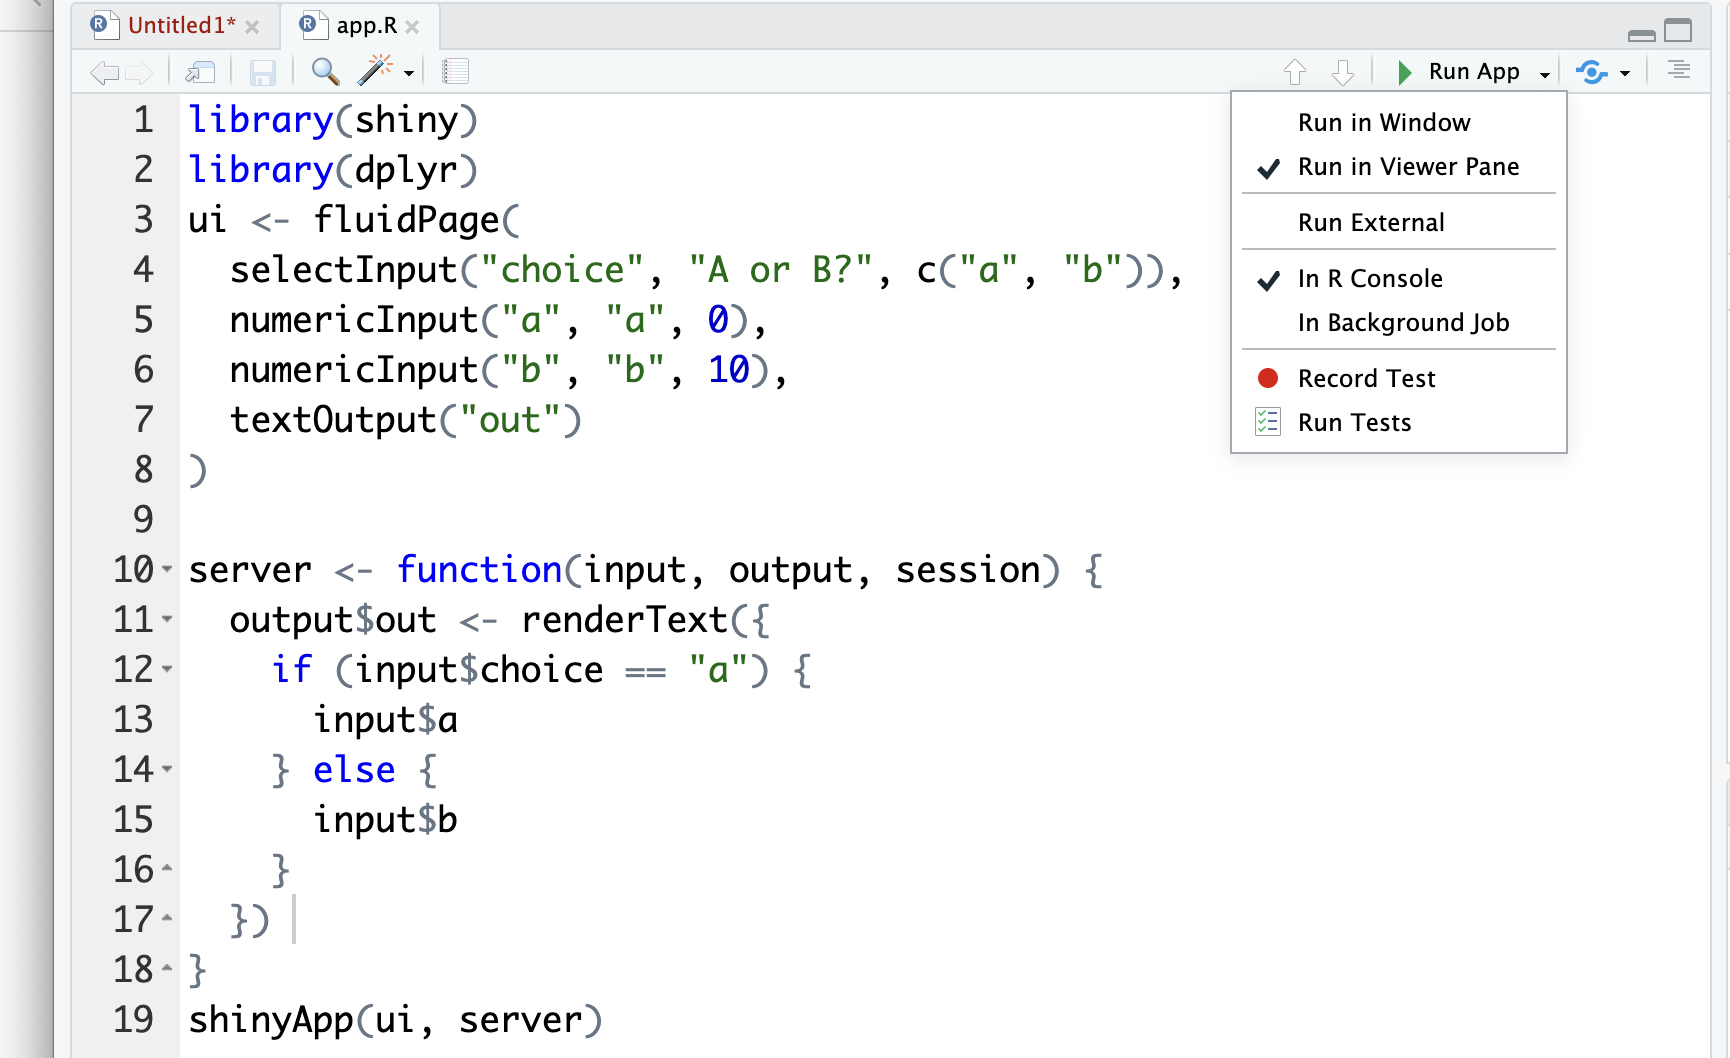
Settings
shinylog
Run it and close it to get this.

reactlog
Chapter 15
Reactives, single and plural
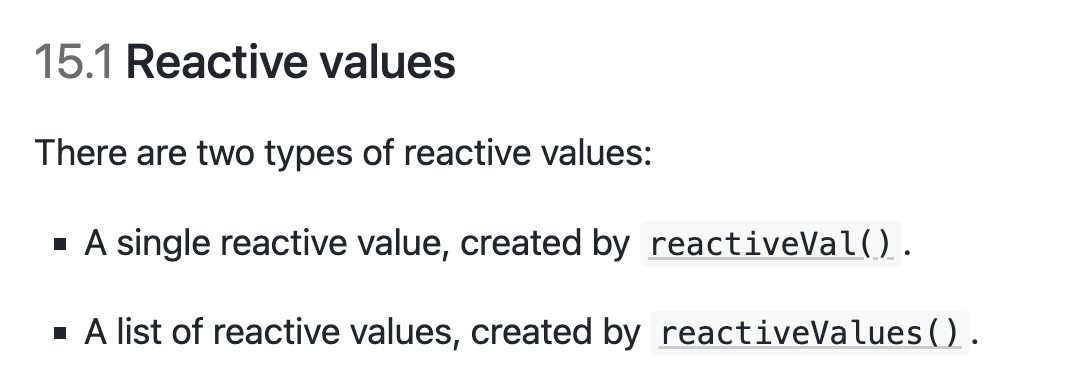
Two types
They Behave a bit Differently
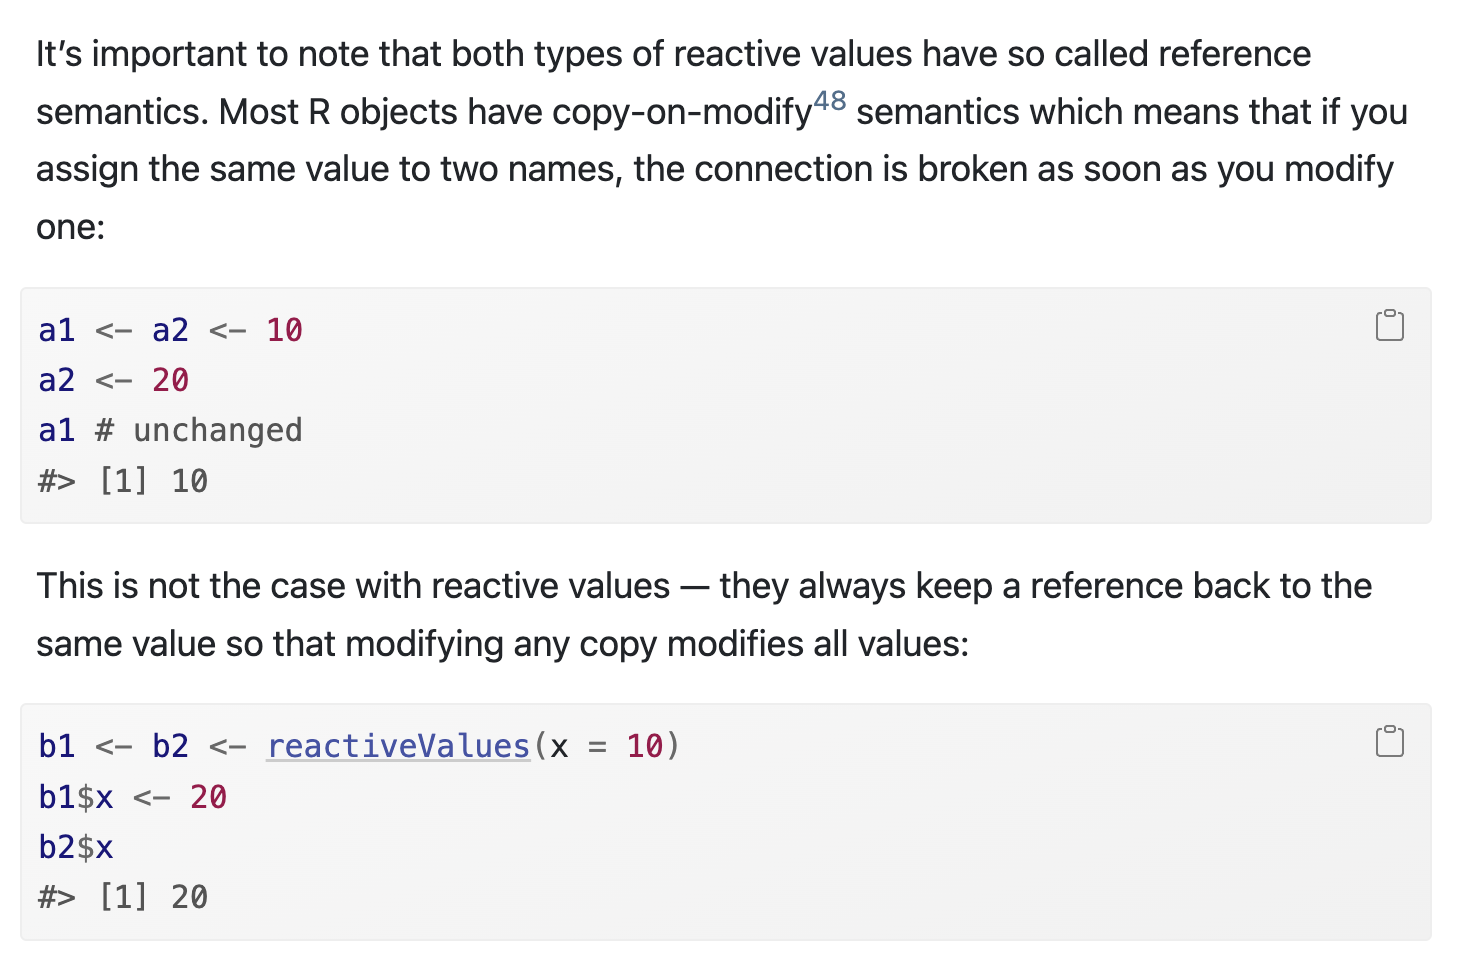
Behavior is a bit different
Observing
Pay very close attention to 15.3 on observe versus observeEvent. The example in 16.3.3…
library(shiny)
reactiveConsole(TRUE)
x <- reactiveVal(1)
y <- observe({
  x()
  observe(print(x()))
})
x(2)
x(3)
x(2)
On Isolate
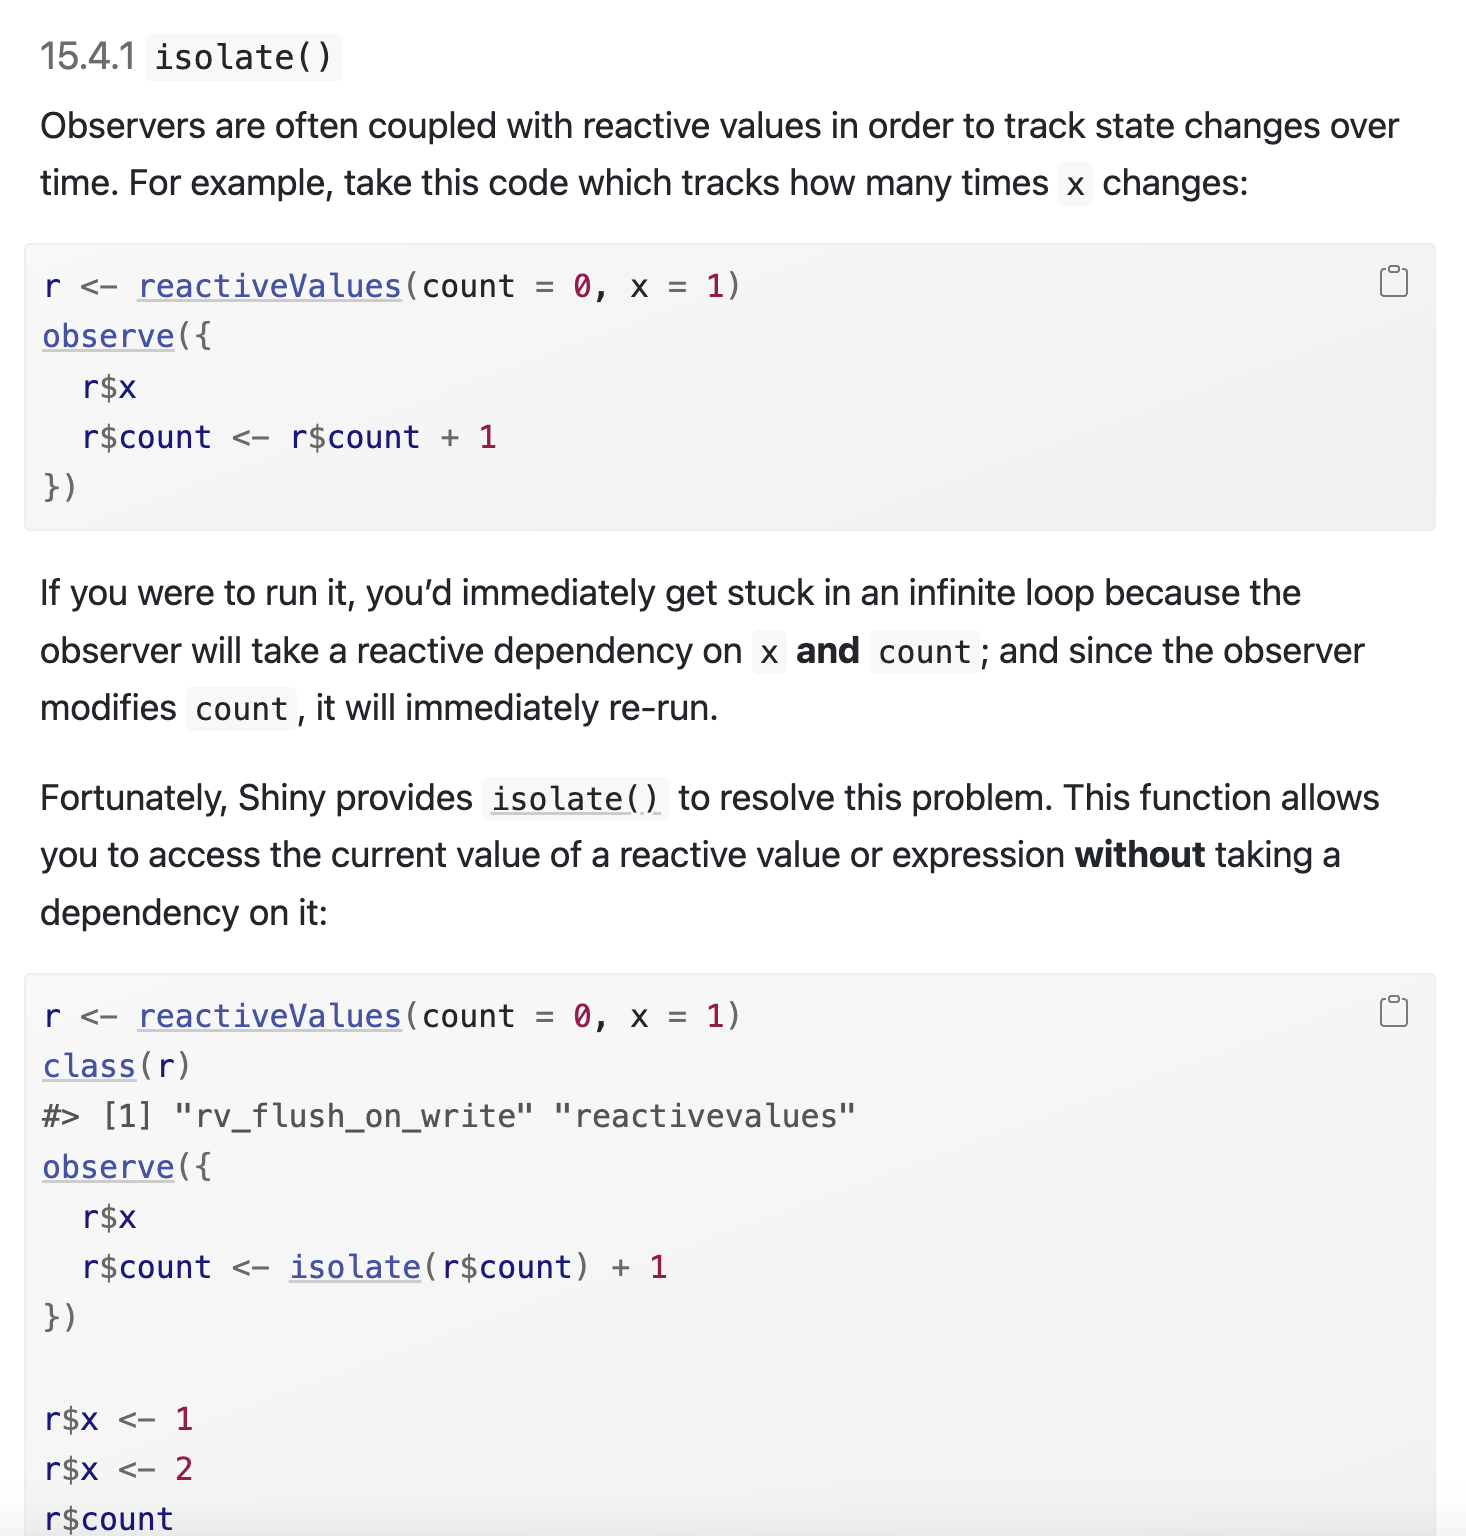
Isolate is not all that common because the behavior is embedded in two common tools:
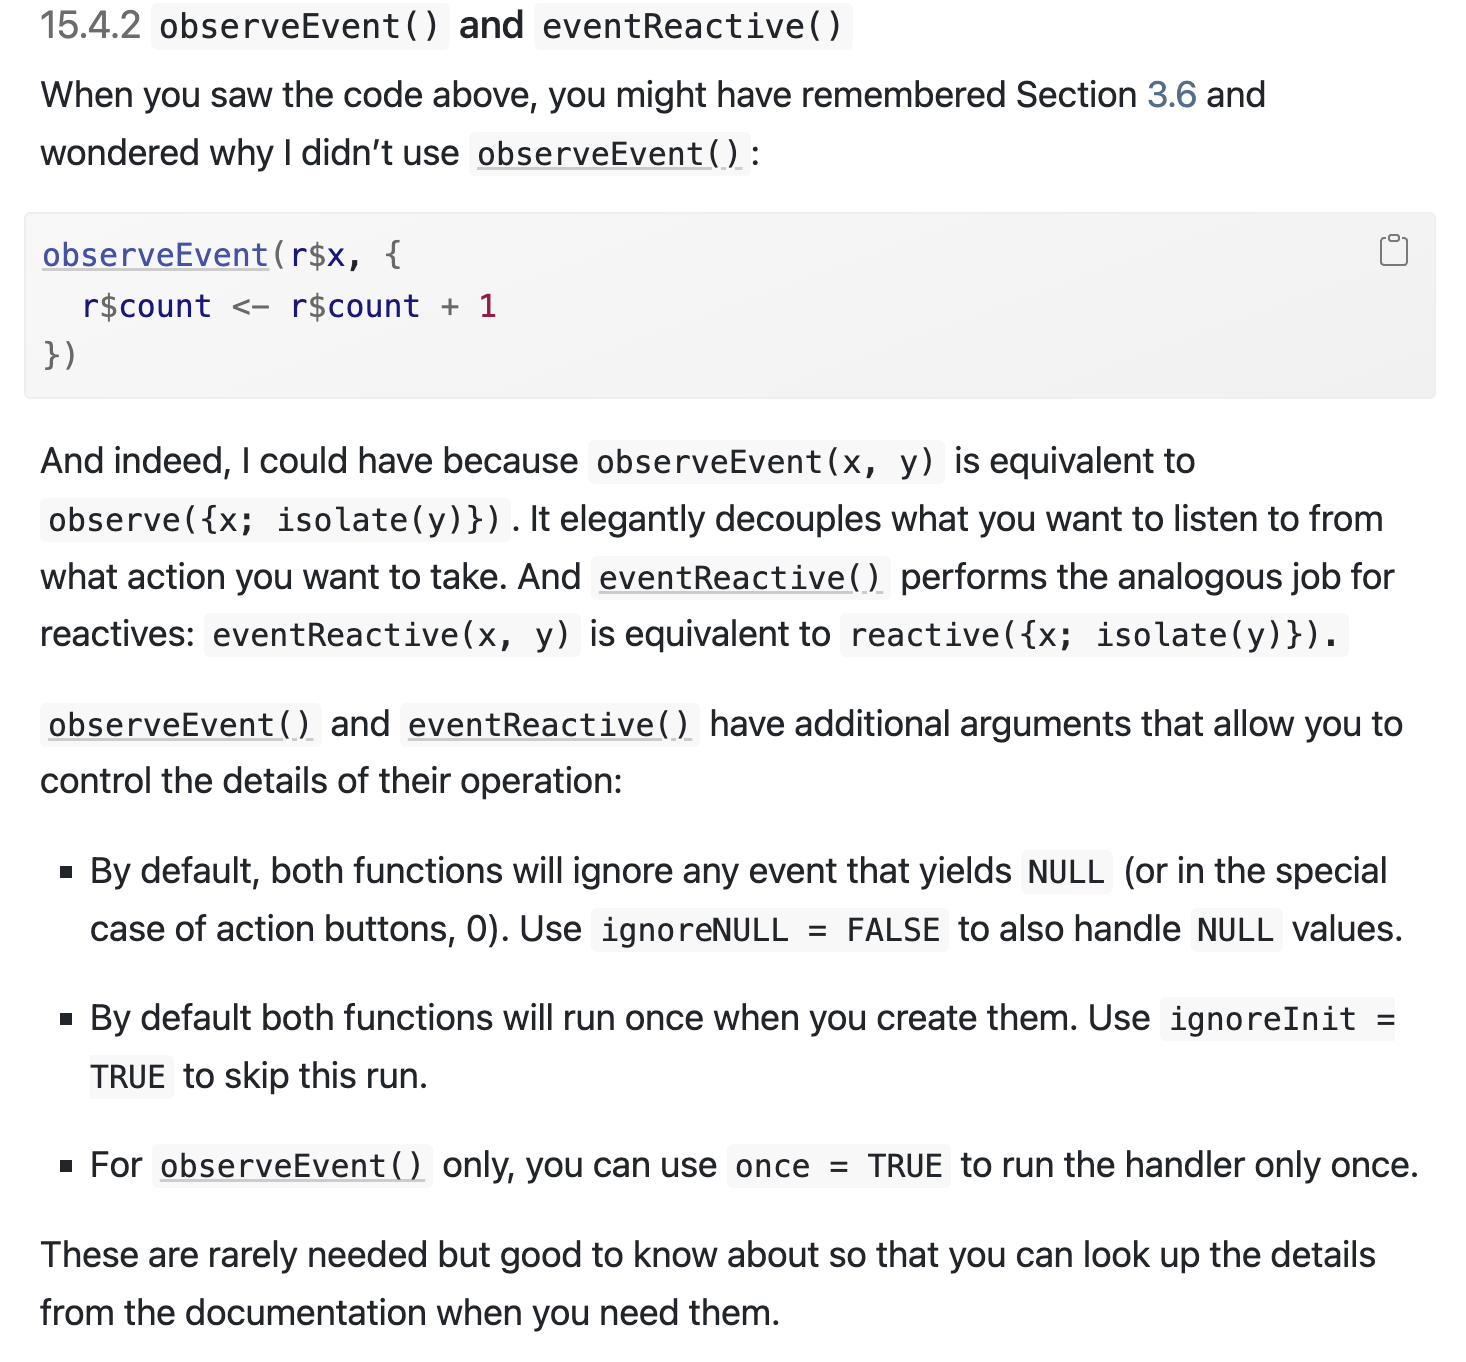
15.5 on timing
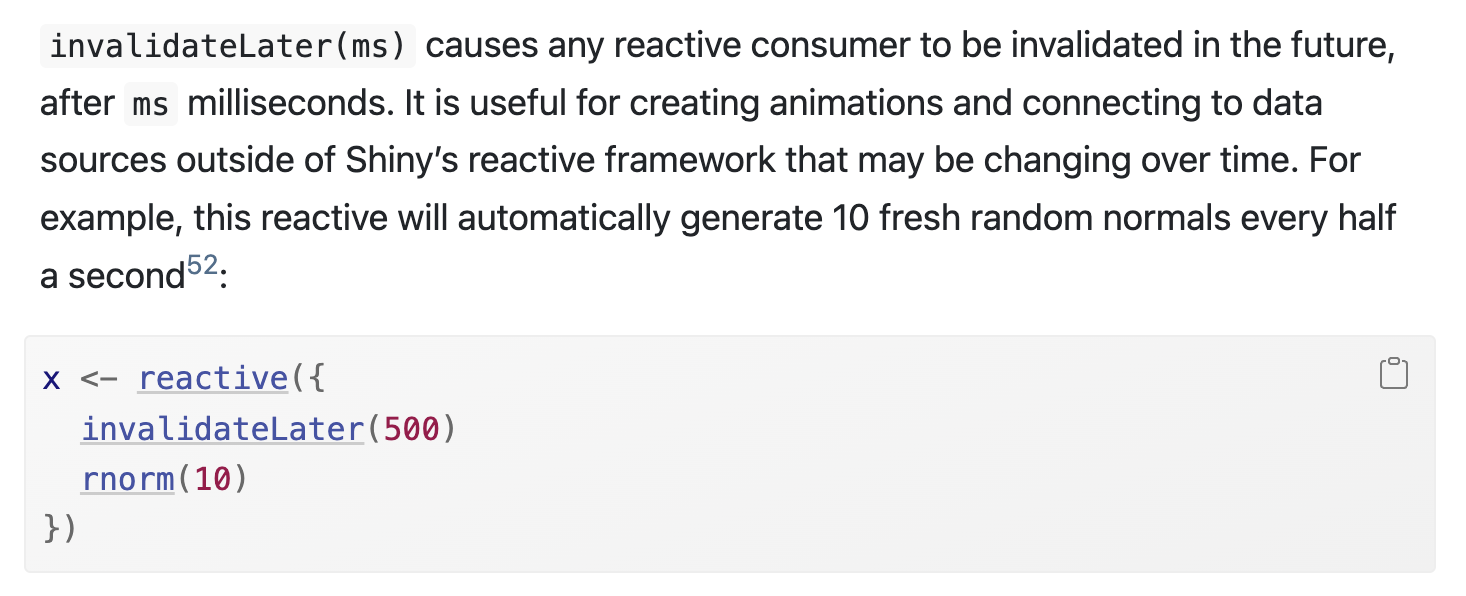
part 1 - invalidateLater
Polling
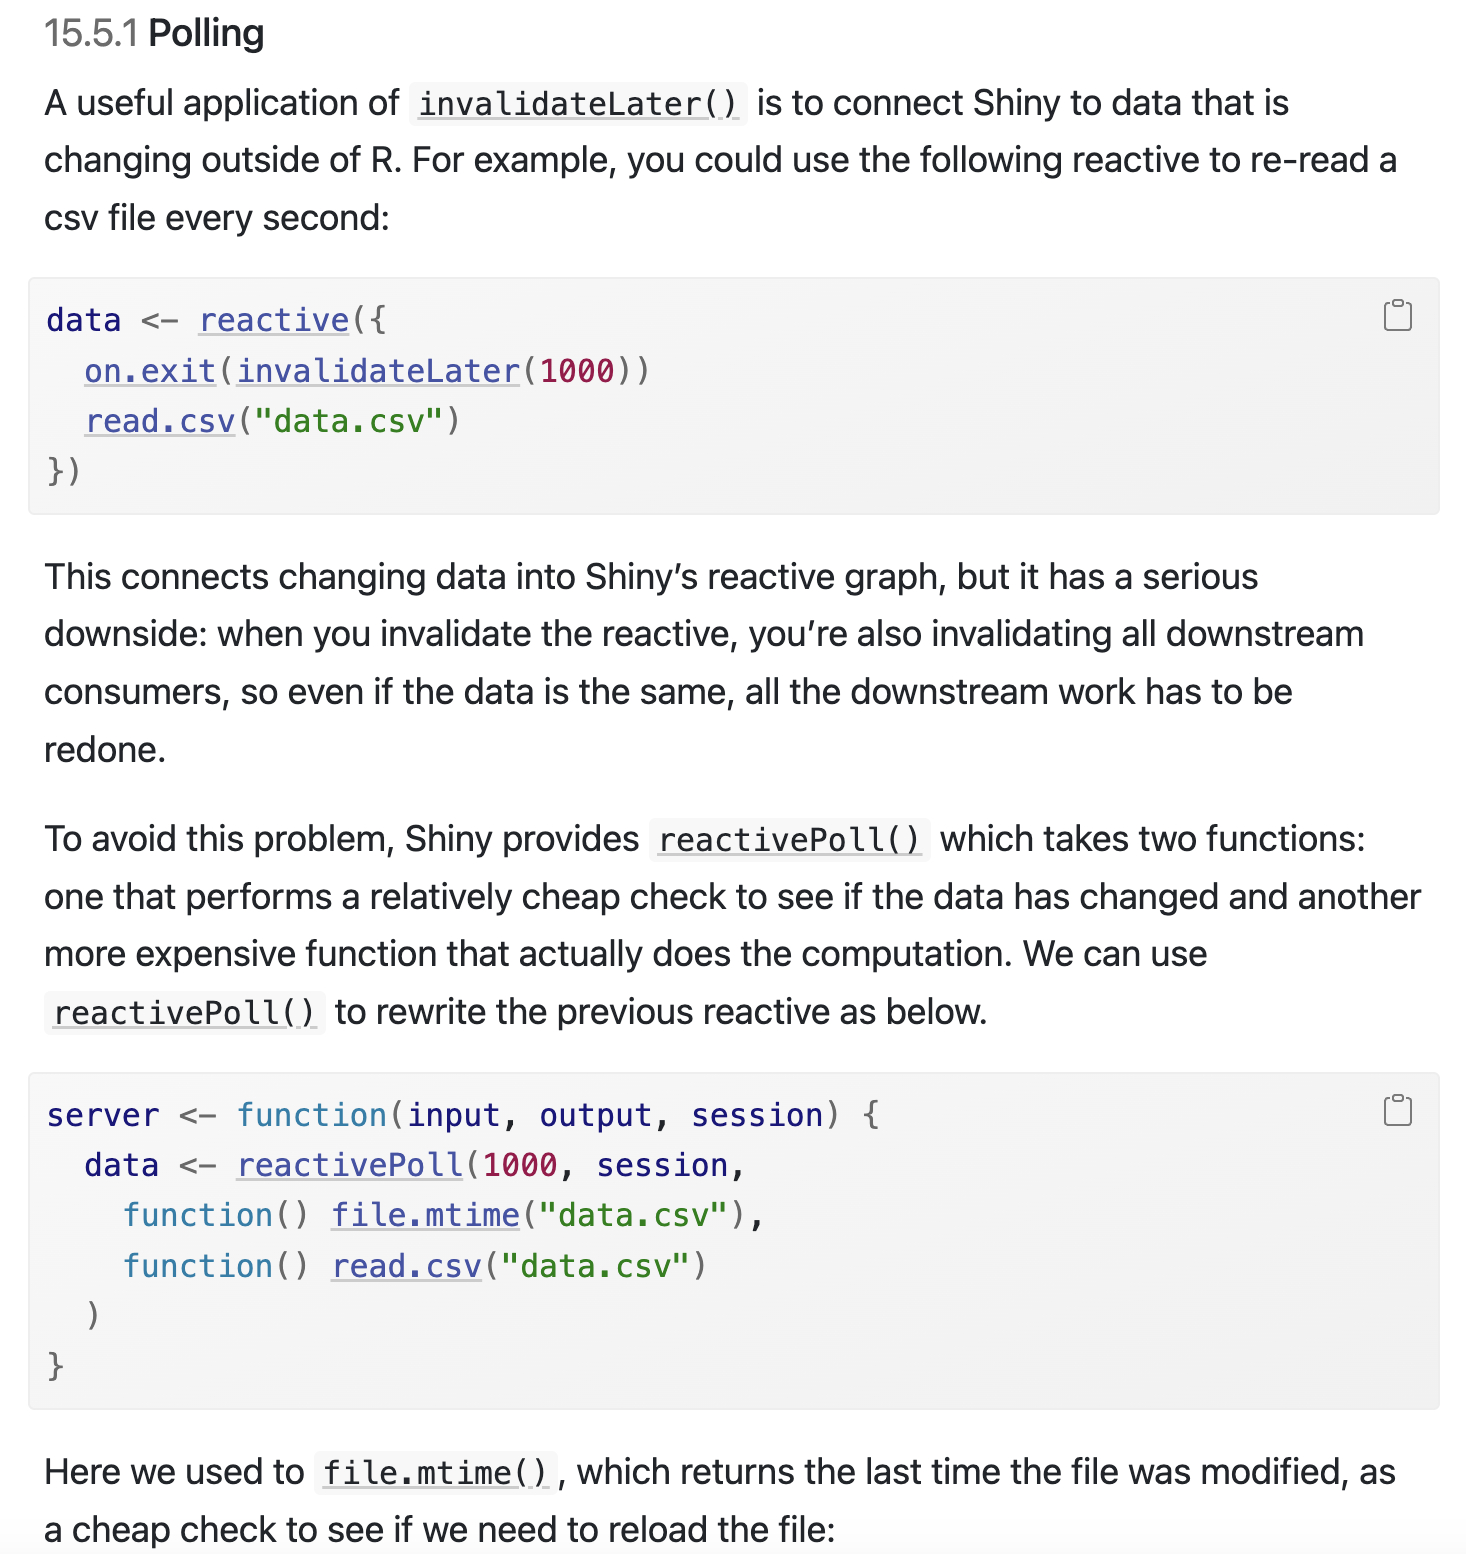
part 2 - Details
on.exit()
15.5.2 and the importance of timing. Using on.exit
Chapter 16: Escaping the Graph
The Case Studies
Two that are related.
The timer
Warnings:
It is quite easy to get carried away and muddle the flow.
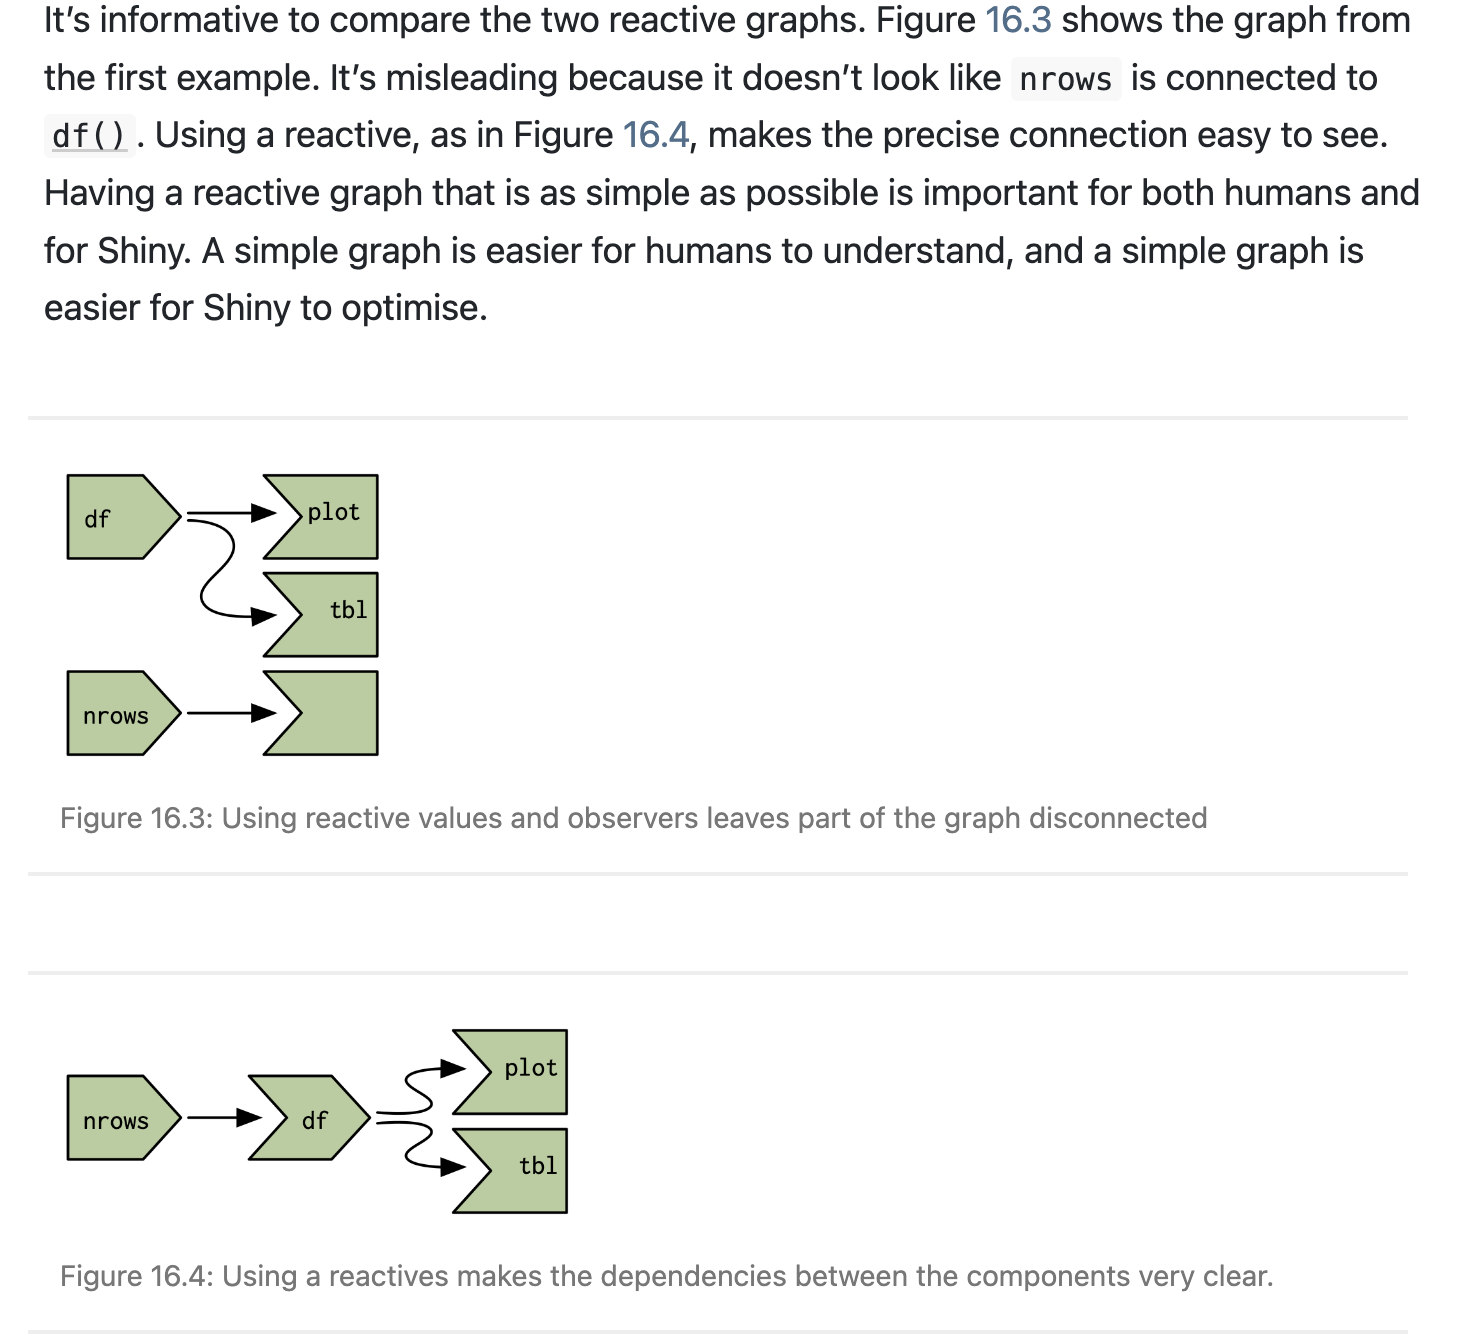
Anti-patterns
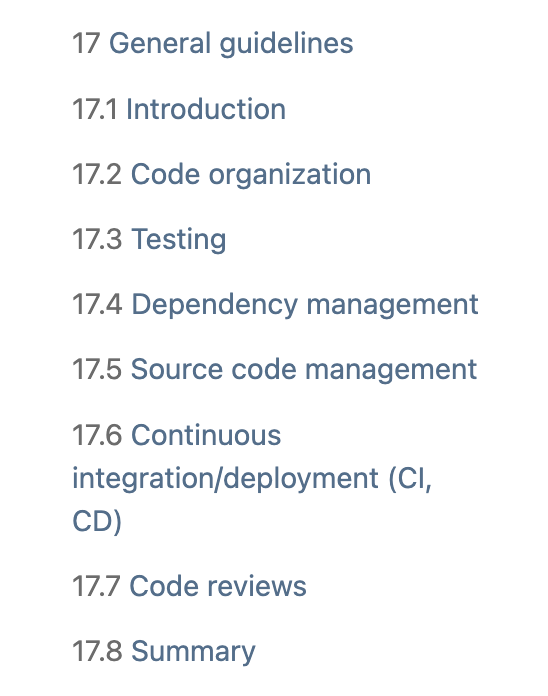
The Path Forward
Shot of Final Section
The Overview

Communicating With Data: Week 11 (3 Apr 2023)