Week 2
Overview
- On Git in a Bit More Detail
- AMA
- RMarkdown Driven Development
- Building a Portfolio with Quarto, Distil, or Blogdown
On GitHub and git
As mentioned last time, Github is a widely used tool in the data science world. While the primary purpose is software development, data science has made heavy use of the environment with all of the advantages (and potential headaches).
The Assignment for this week
Was a minimal collaboration using Github. There were two ways to accomplish it. My example contains elements of both, first 2 then 1.
- Issues/pull requests with maintenance responsibility.
- Commit/push/merge
Discussing the Methods
At least one group tried it both ways. Let’s talk this through.
Setting up Github and RStudio
- Personal Access Tokens
- Limitations of RStudio’s interface
- Pull with rebase
Other Alternatives
There are tons. I tend to use GitKraken because it was the first thing that I tried and it works. YMMV.
usethis
Setting this up makes interacting with Git far easier from RStudio.
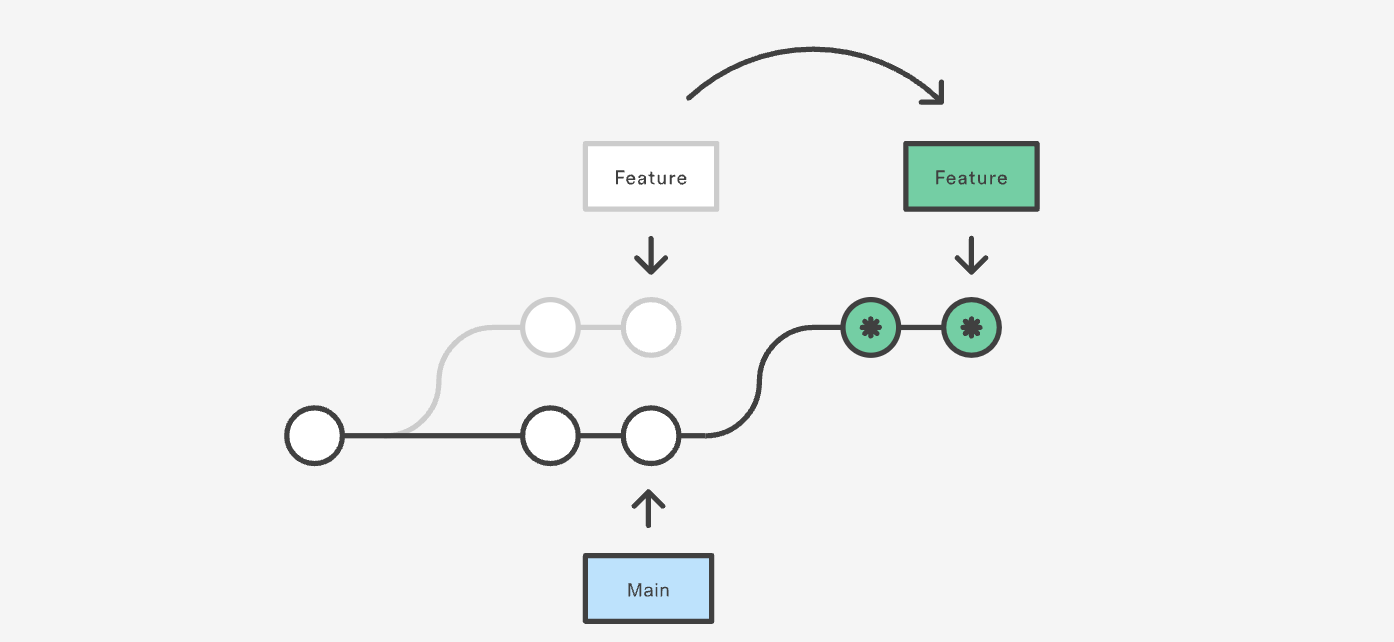
A Typical Workflow [1]
- Fork the repository.
- Make changes to the fork.
- Issue a pull request to integrate the changes in the fork into the main branch.
A Typical Workflow [2]
- Open the project.
- Make whatever changes you wish to make to completion.
- Commit the changes
- Push your changes.
AMA
#tidyTuesdayas a source of data and an awesome collection of neat visualizations- Resources:
stackoverflowand Posit Community
The Structure of an RMarkdown/Quarto document
- The top stuff in between three dashes is YAML [YAML is not a Markup Language]
- The markdown syntax
- Code chunks and options within them [the indicated methods differ a little between RMarkdown and Quarto but the old/RMarkdown method works]
Developing in RMarkdown

Overview
Taking out the Trash
- Do not hardcode passwords.
- Do not hardcode values, especially late in the script.
- Do not hardcode absolute file paths. [here is magic for this]
- Do not do complicated database queries. [Cache or localize]
- Don’t litter.
- Don’t load unneccesary libraries.
Organization is Bliss
Tips: echo=FALSE and results="hide", include=FALSE
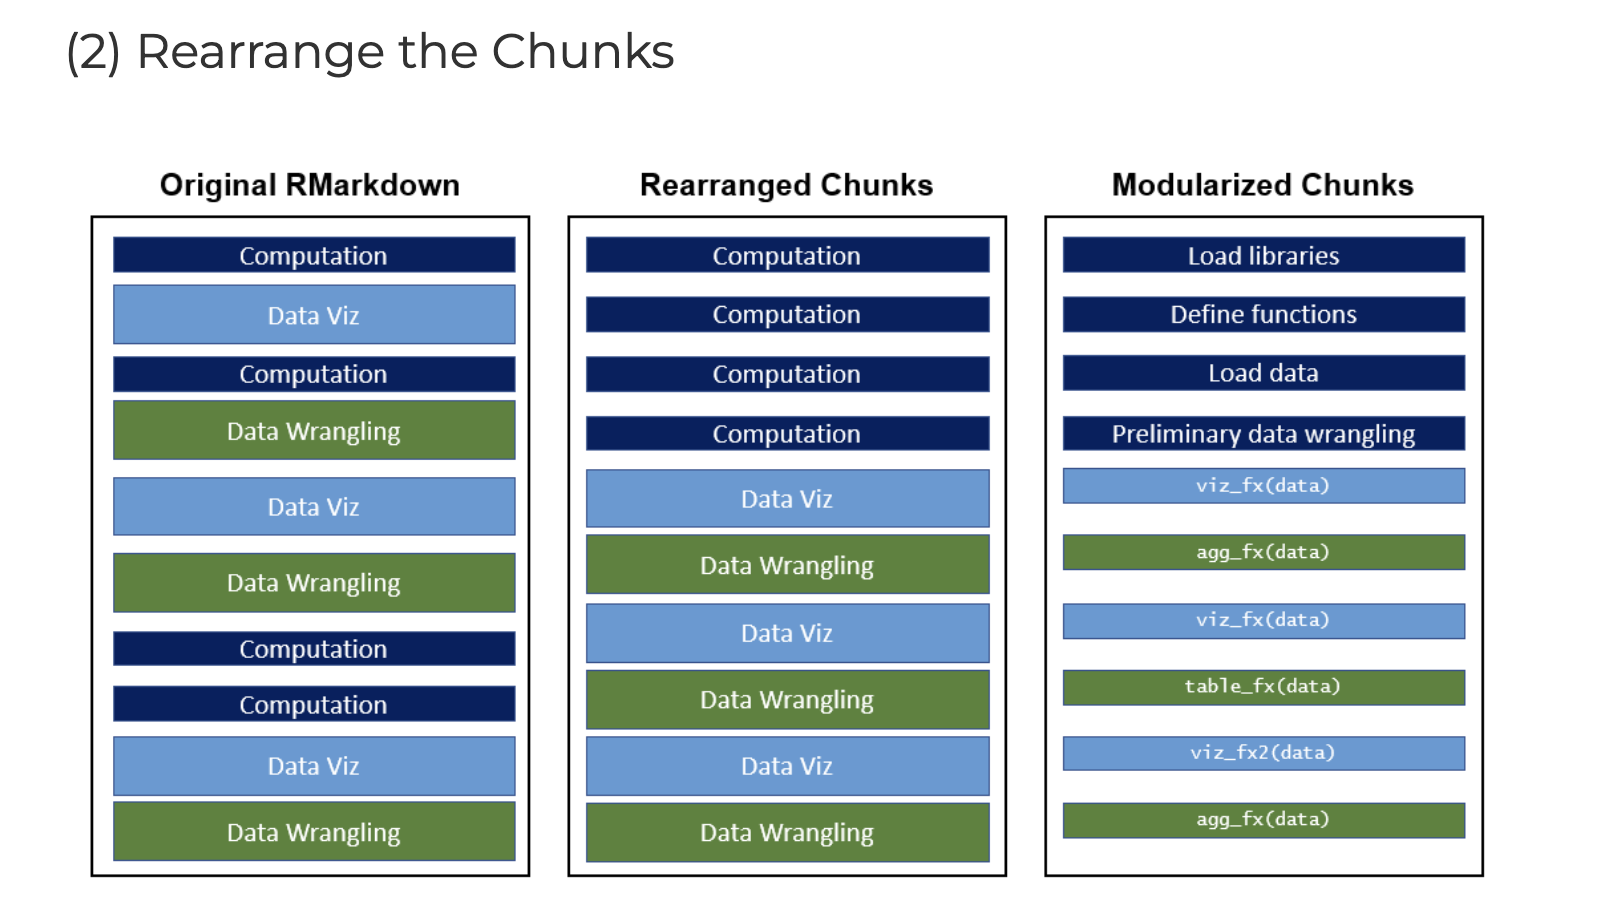
Organization Diagrams
Functions Save Time and Energy
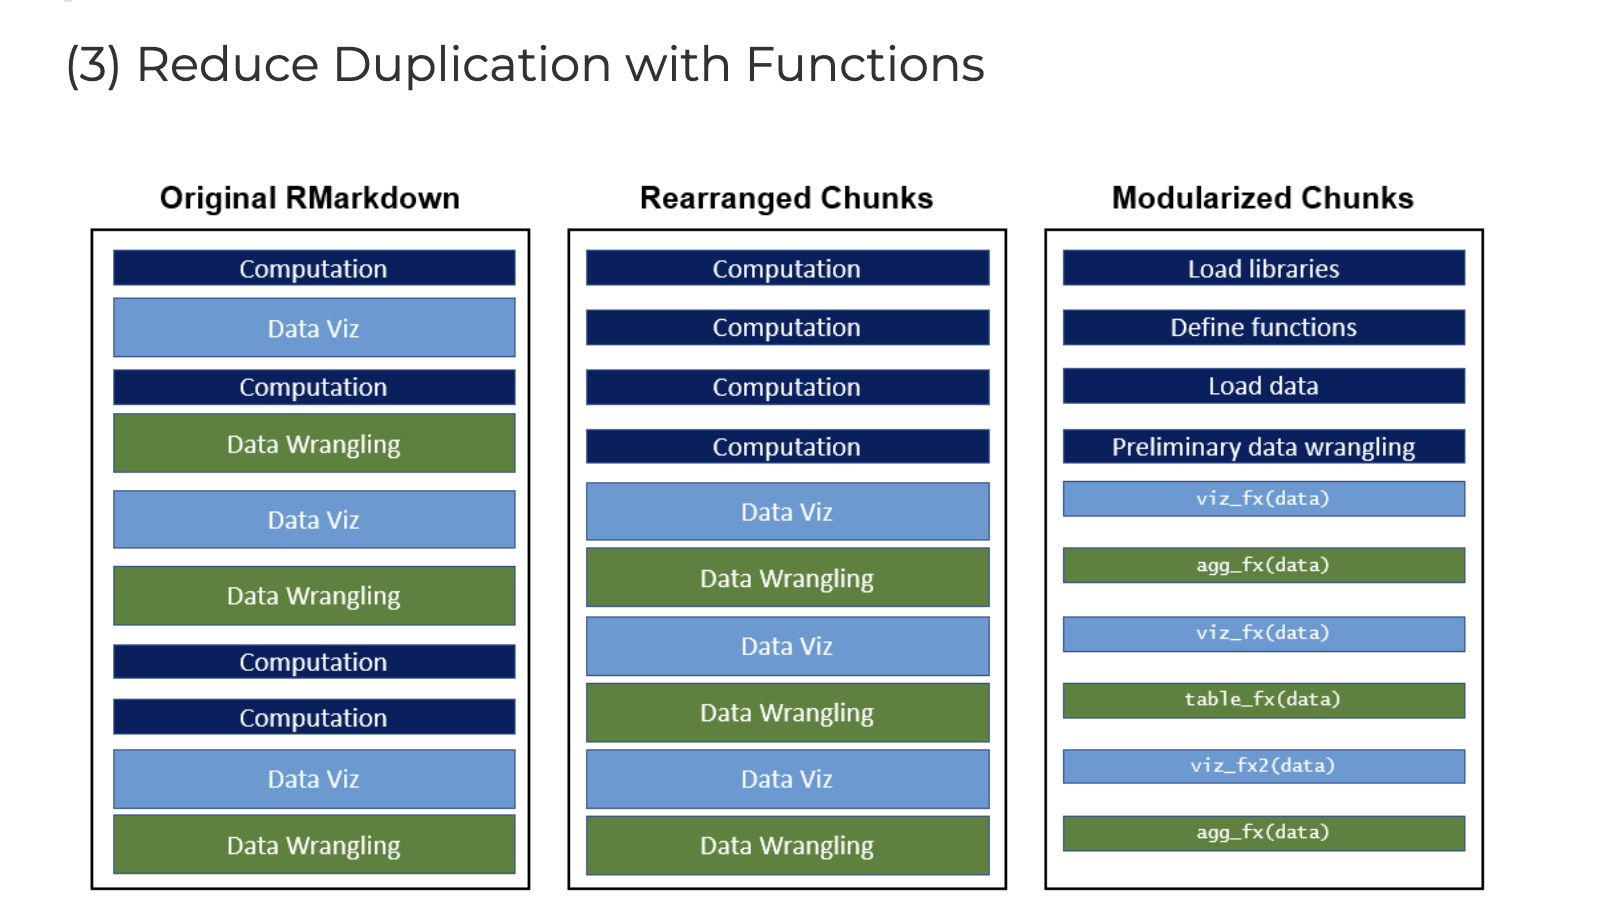
The function workflow
Conversion to Projects
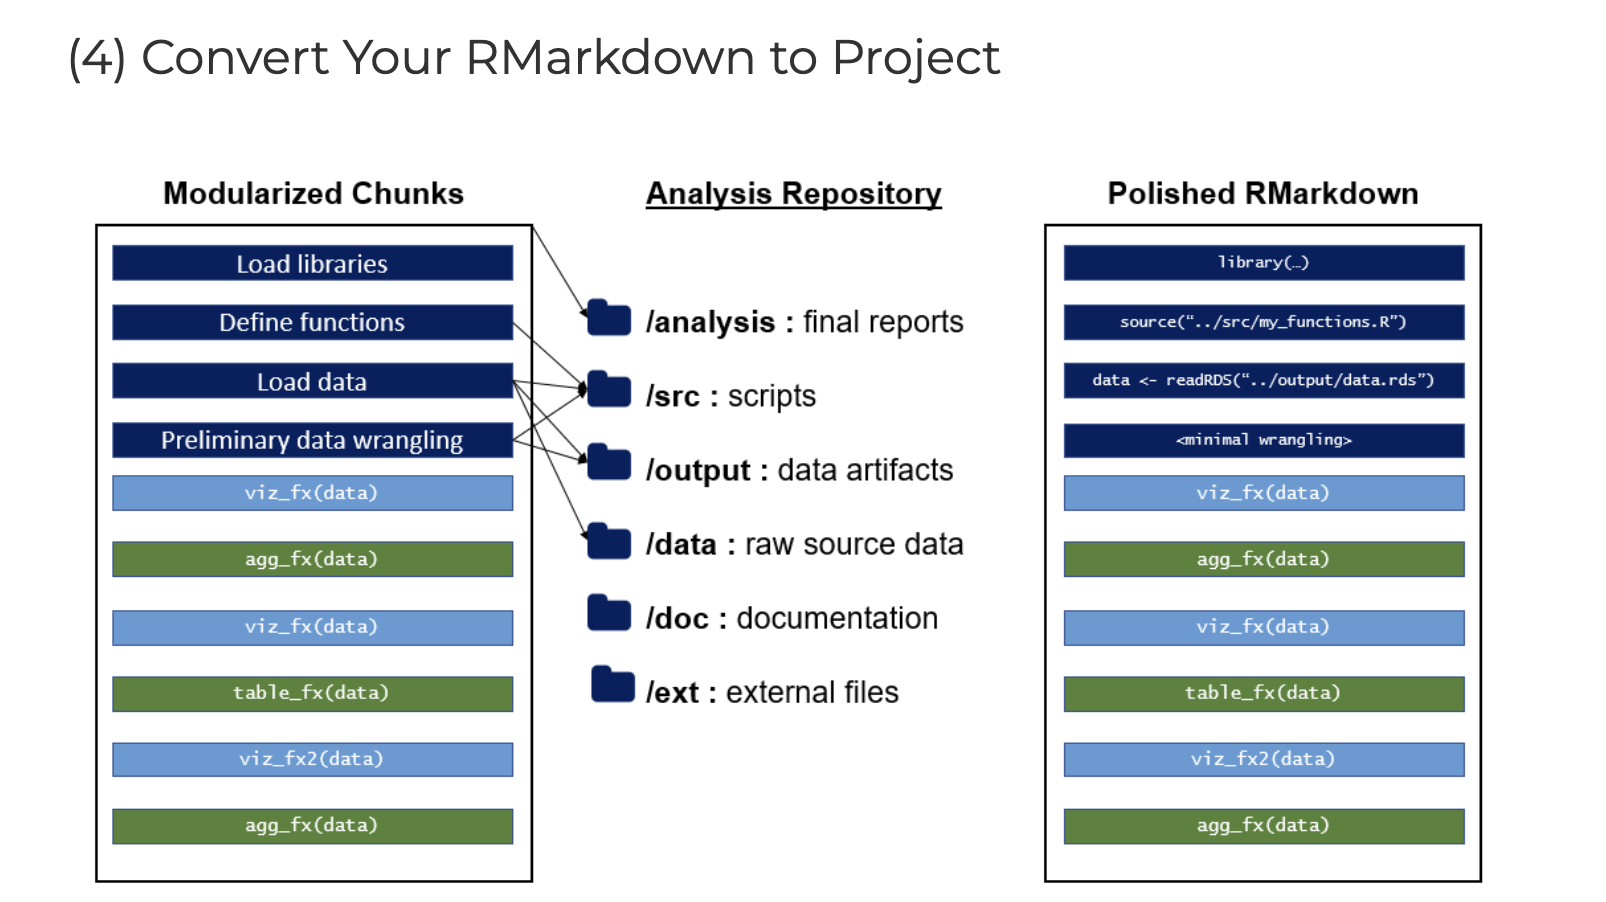
Project Structure
Project to Package
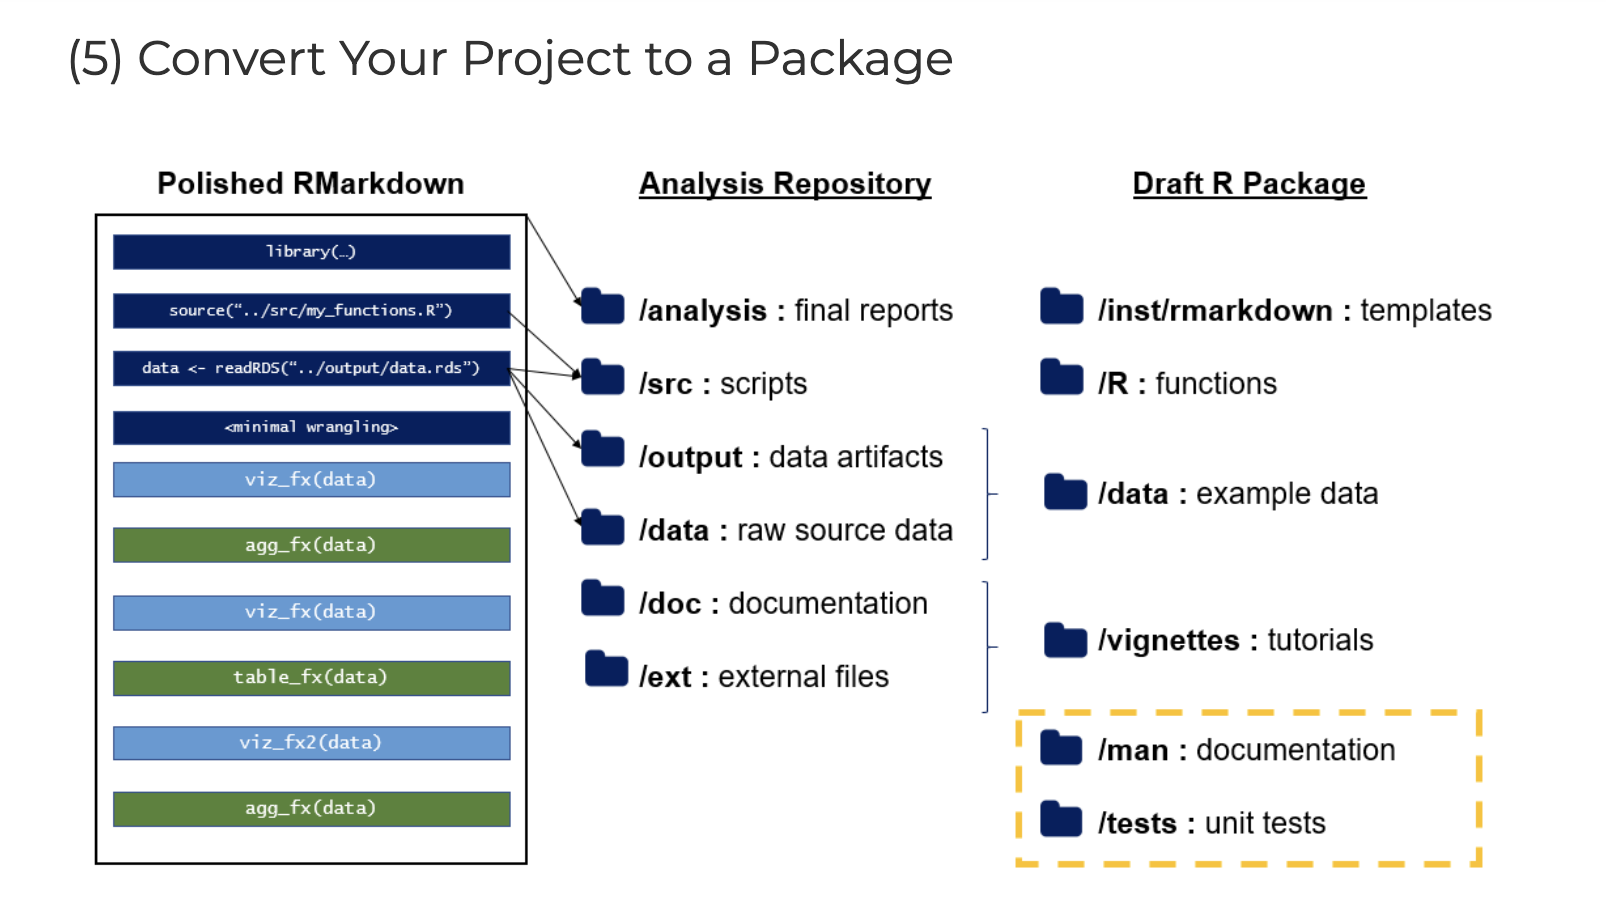
Project -> Package
Takeaways
The first three are crucial. Four and five depend on the analytical task. For throwaways, this is overkill. For repeated tasks, going at least through four is ideal. For oft-repeated tasks, all of them make sense.
Emily’s Talk at RStudio::conf 2020 is definitely worth checking out.
On a Portfolio
Preliminary questions:
- where do you want to host it? Do you need a fancy domain name?
- Setting up rendering?
- Templates
- Alison Presmanes Hill’s pdx-rug workshop. You can pull the template.
- Also, quarto websites and blogs.
A Very Quick One
I can get a something up in only a few minutes. Let’s walk through that.
For Next Time
Let’s build at least a barebones portfolio. I don’t care which method you choose though I have used blogdown for years and am somewhat new to quarto.
If you want to use blogdown, I would strongly encourage you to basically follow along here. It is a nice walkthrough.
Partly for next week’s assignment, browse the tidyTuesday archives, find a visualization, and try a modification of it in a post. Or some other post of interest. So that we know how to extend it. We are going to add to it from here.

Communicating With Data: Week 2 (23 Jan 2023)
