```{r}
library(MASS); library(foreign)
Li.Data <- read.dta("./data/li-replication.dta")
table(Li.Data$generosityg)
Li.Data$generositygF <- as.factor(Li.Data$generosityg)
```
 0  1  2  3  4  5  6
13 10 19 7 2 1 1 Robert W. Walker
September 26, 2022
The slides are here..
Our fifth class meeting will focus on Chapter 8 of Handbook of Regression Modeling in People Analytics.
Hierarchical models represent an advance on more standard linear and generalized linear models with the recognition that data have hierarchical forms of organization with varying degrees of freedom for the predictors. These models can, generically, be combined with techniques that we have already learned to expand the range of our toolkit. Since we left last week off with ordered models, they will first occupy our attention.
My preferred method of thinking about ordered regression involves latent variables. So what is a latent variable? It is something that is unobservable, hence latent, and we only observe coarse realizations in the form of qualitative categories. Consider the example from Li in the Journal of Politics.

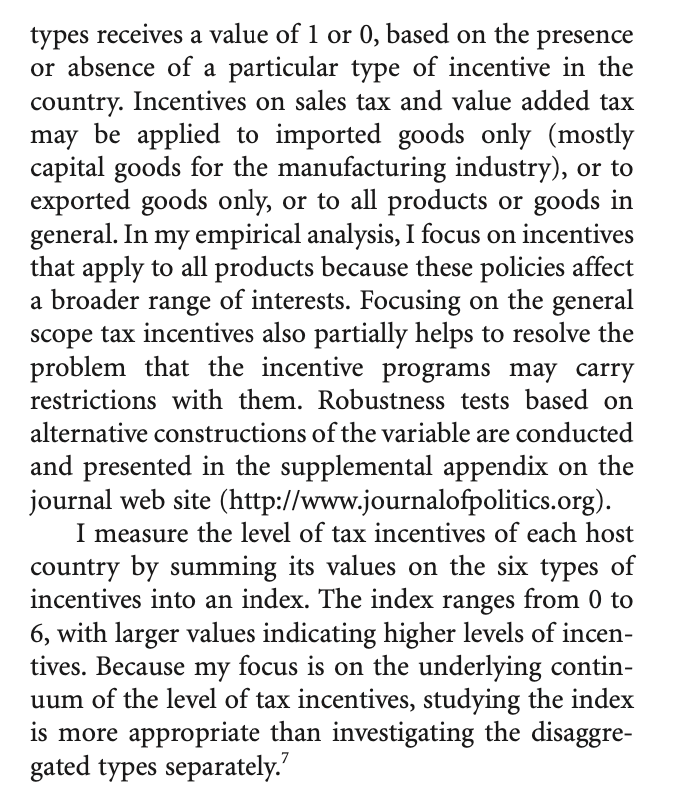
The outcome is summed from six individual types of incentives. They are explained here.

and
There are two parts to the data description for the inputs.
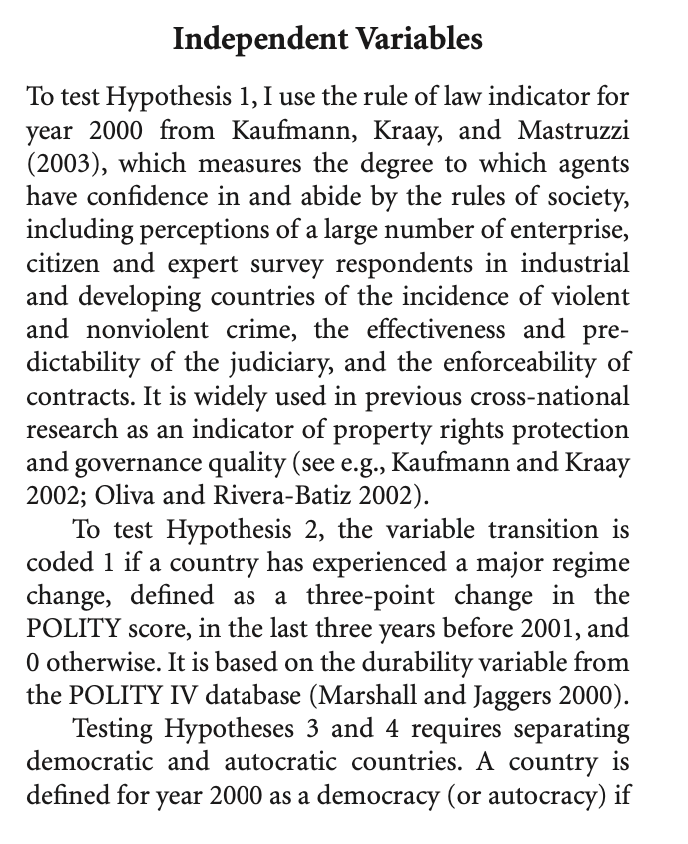
and 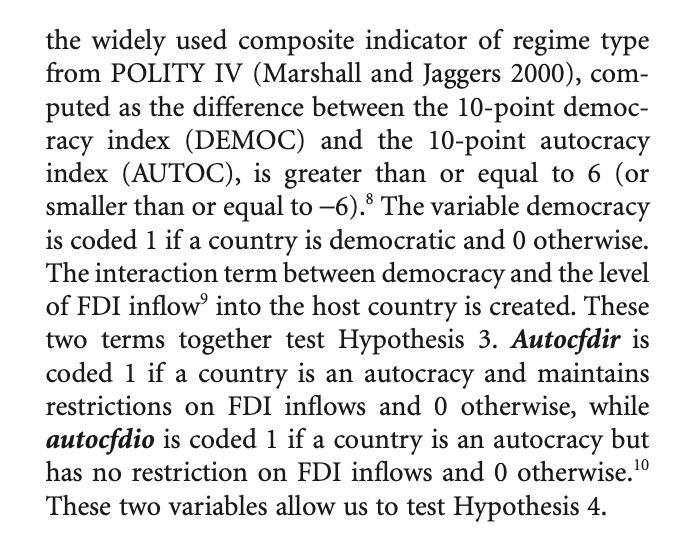
and there is a further description of other variables that are deployed.

and

This should give us an idea of what is going on. The data come in Stata format; we can read these via the foreign or haven libraries in R.
```{r}
library(MASS); library(foreign)
Li.Data <- read.dta("./data/li-replication.dta")
table(Li.Data$generosityg)
Li.Data$generositygF <- as.factor(Li.Data$generosityg)
```
0 1 2 3 4 5 6
13 10 19 7 2 1 1 It is worthwhile to notice that the top of the scale is rather sparse.
There is also a concern about FDI and economies of scale. The following is a plot of the relationship between FDI and size of the economy in the sample.
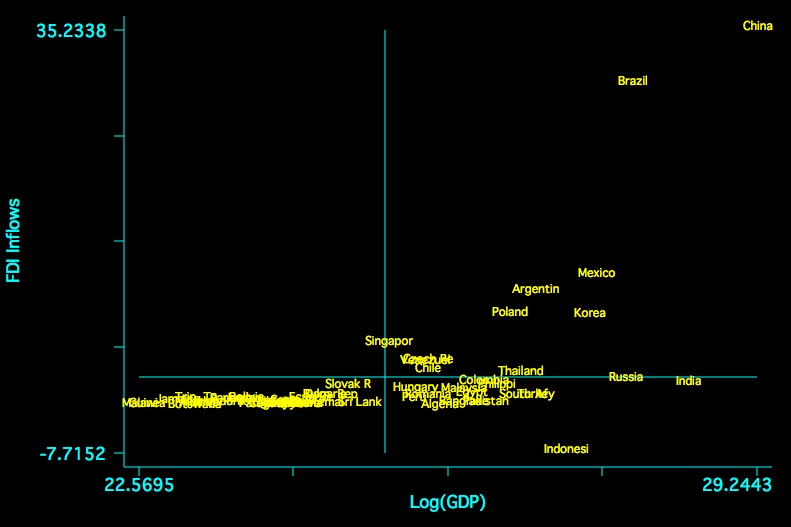
Without careful attention to normalization, China is a clear x-y outlier.
Suppose there is some unobserved continuous variable, call it \(y^{*}\) that measures the willingness/utility to be derived from tax incentives to FDI. Unfortunately, this latent quantity is unobservable; we instead observe how many incentives are offered and posit that the number of incentives is a manifestation of increasing utility with unknown points of separation – cutpoints – that separate these latent utilities into a mutually exclusive and exhaustive partition. In a simplified example, consider this.
So anything below -3 is zero incentives; anything between -3 and -2 is one incentive, … , and anything above 4 should be all six incentives. What we have is a regression problem but the outcome is unobserved and takes the form of a logistic random variable. Indeed, one could write the equation as:
\[y^{*} = X\beta + \epsilon\]
where \(\epsilon\) is assumed to have a logistic distribution but this is otherwise just a linear regression. Indeed, the direct interpretation of the slopes is the effect of a one-unit change in X on that logistic random variable.
The table of estimates is presented in the paper; I will copy it here.
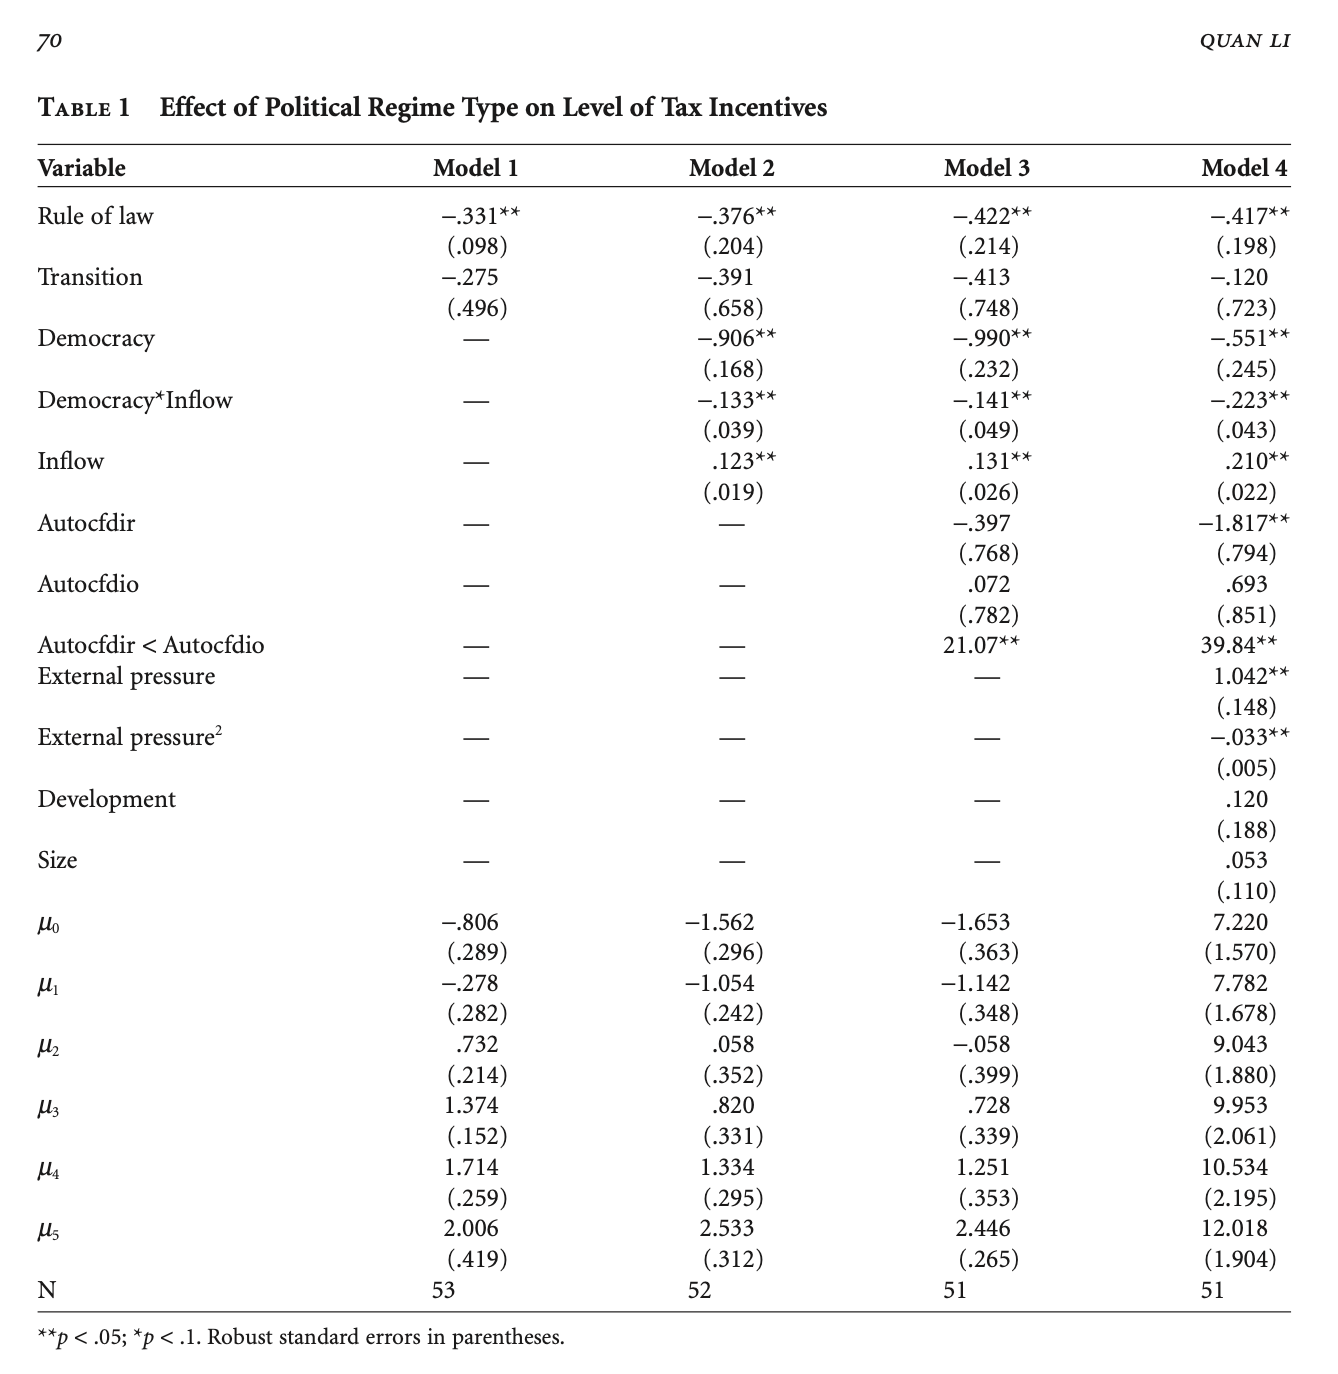
I will choose two of a few models estimated in the paper. First, let us have a look at Model 1.
Re-fitting to get HessianCall:
polr(formula = generositygF ~ law00log + transition, data = Li.Data)
Coefficients:
Value Std. Error t value
law00log -0.6192 0.4756 -1.3019
transition -0.5161 0.7126 -0.7243
Intercepts:
Value Std. Error t value
0|1 -1.3617 0.3768 -3.6144
1|2 -0.4888 0.3323 -1.4707
2|3 1.1785 0.3668 3.2133
3|4 2.3771 0.5361 4.4339
4|5 3.1160 0.7325 4.2541
5|6 3.8252 1.0183 3.7565
Residual Deviance: 164.3701
AIC: 180.3701 We can read these by stars. There is nothing that is clearly different from zero as a slope or 1 as an odds-ratio. The authors deploy a common strategy for adjusting standard errors that, in this case, is necessary to find a relationship with statistical confidence. That’s a diversion. To the story. In general, the sign of the rule of law indicator is negative, so as rule of law increases, incentives decrease though we cannot rule out no effect. Transitions also have a negative sign; regime changes have no clear influence on incentives. There is additional information that is commonly given short-shrift. What do the cutpoints separating the categories imply? Let’s think this through recongizing that the estimates have an underlying t/normal distribution. 4|5 is within one standard error of both 3|4 and 5|6. The model cannot really tell these values apart. Things do improve in the lower part of the scale but we should note that this is where the vast majority of the data are actually observed.
Next, I will turn the estimates into odds-ratios by exponentiating the estimates.
For Kawika, this is one of the many cases that I am familiar with where robust is necessary to find something. Note neither effect can be differentiated from zero with much confidence at all. To further examine the claims, I will also replicate the right-most column.
```{r}
li.mod4 <- polr(generositygF ~ law00log + transition + fdiinf + democfdi + democ + autocfdi2 + autocfdir + reggengl + reggengl2 + gdppclog + gdplog, data=Li.Data)
summary(li.mod4)
```
Re-fitting to get HessianCall:
polr(formula = generositygF ~ law00log + transition + fdiinf +
democfdi + democ + autocfdi2 + autocfdir + reggengl + reggengl2 +
gdppclog + gdplog, data = Li.Data)
Coefficients:
Value Std. Error t value
law00log -0.89148 0.66806 -1.3344
transition -0.57123 0.94945 -0.6016
fdiinf 0.37605 0.18055 2.0828
democfdi -0.39969 0.18228 -2.1927
democ -1.23307 0.77661 -1.5878
autocfdi2 1.24932 1.94198 0.6433
autocfdir -3.17796 1.95351 -1.6268
reggengl 1.81476 0.44754 4.0550
reggengl2 -0.05777 0.01444 -4.0007
gdppclog 0.20891 0.43867 0.4762
gdplog 0.15754 0.18138 0.8686
Intercepts:
Value Std. Error t value
0|1 13.7773 0.1020 135.0542
1|2 14.7314 0.3048 48.3349
2|3 16.9740 0.5230 32.4561
3|4 18.7911 0.8027 23.4107
4|5 20.0387 1.1590 17.2900
5|6 23.2947 4.7216 4.9336
Residual Deviance: 134.2212
AIC: 168.2212
(2 observations deleted due to missingness)Measured via odds-ratios, we can obtain those:
Goodness of Fit:
```{r}
DescTools::PseudoR2(
  li.mod1,
  which = c("McFadden", "CoxSnell", "Nagelkerke", "AIC")
)
DescTools::PseudoR2(
  li.mod4,
  which = c("McFadden", "CoxSnell", "Nagelkerke", "AIC")
)
```
McFadden CoxSnell Nagelkerke AIC
0.01104919 0.03405653 0.03560378 180.37009764
McFadden CoxSnell Nagelkerke AIC
0.1649728 0.4054507 0.4235700 168.2212440 The last model is clearly better than the first by any of these measures. That said, there are a lot of additional predictors that add much complexity to the model and the difference in AIC is not very large.
What about the others?
They fail to work because of sparseness.
The text cites a test that owes to Brant on examining proportionality. It turns out that I know a bit about this; I published a purely theoretical stats paper showing that it is not at all clear what the alternative hypothesis embodied in this test actually means because the only model with a proper probability distribution for \(y^{*}\) is this proportional-odds model.
I will follow the text with this caveat in mind:
--------------------------------------------
Test for    X2  df  probability
--------------------------------------------
Omnibus     13.51   10  0.2
law00log    8.64    5   0.12
transition  4.28    5   0.51
--------------------------------------------

H0: Parallel Regression Assumption holds── Attaching packages ─────────────────────────────────────── tidyverse 1.3.2 ──
✔ ggplot2 3.3.6 ✔ purrr 0.3.4
✔ tibble 3.1.8 ✔ dplyr 1.0.9
✔ tidyr 1.2.0 ✔ stringr 1.4.1
✔ readr 2.1.2 ✔ forcats 0.5.2
── Conflicts ────────────────────────────────────────── tidyverse_conflicts() ──
✖ dplyr::filter() masks stats::filter()
✖ dplyr::lag() masks stats::lag()
✖ dplyr::select() masks MASS::select()```{r}
Mat.Fit$pred.val <- rep(-999, 51)
Mat.Fit$pred.val[Mat.Fit$X0 > Mat.Fit$X1 & Mat.Fit$X0 > Mat.Fit$X2 & Mat.Fit$X0 > Mat.Fit$X3 & Mat.Fit$X0 > Mat.Fit$X4 & Mat.Fit$X0 > Mat.Fit$X5 & Mat.Fit$X0 > Mat.Fit$X6] <- 0
Mat.Fit$pred.val[Mat.Fit$X1 > Mat.Fit$X0 & Mat.Fit$X1 > Mat.Fit$X2 & Mat.Fit$X1 > Mat.Fit$X3 & Mat.Fit$X1 > Mat.Fit$X4 & Mat.Fit$X1 > Mat.Fit$X5 & Mat.Fit$X1 > Mat.Fit$X6] <- 1
Mat.Fit$pred.val[Mat.Fit$X2 > Mat.Fit$X0 & Mat.Fit$X2 > Mat.Fit$X1 & Mat.Fit$X2 > Mat.Fit$X3 & Mat.Fit$X2 > Mat.Fit$X4 & Mat.Fit$X2 > Mat.Fit$X5 & Mat.Fit$X2 > Mat.Fit$X6] <- 2
Mat.Fit$pred.val[Mat.Fit$X3 > Mat.Fit$X0 & Mat.Fit$X3 > Mat.Fit$X1 & Mat.Fit$X3 > Mat.Fit$X2 & Mat.Fit$X3 > Mat.Fit$X4 & Mat.Fit$X3 > Mat.Fit$X5 & Mat.Fit$X3 > Mat.Fit$X6] <- 3
Mat.Fit$pred.val[Mat.Fit$X5 > Mat.Fit$X0 & Mat.Fit$X5 > Mat.Fit$X1 & Mat.Fit$X5 > Mat.Fit$X2 & Mat.Fit$X5 > Mat.Fit$X3 & Mat.Fit$X5 > Mat.Fit$X4 & Mat.Fit$X5 > Mat.Fit$X6] <- 5
Mat.Fit$pred.val[Mat.Fit$X6 > Mat.Fit$X0 & Mat.Fit$X6 > Mat.Fit$X1 & Mat.Fit$X6 > Mat.Fit$X2 & Mat.Fit$X6 > Mat.Fit$X3 & Mat.Fit$X6 > Mat.Fit$X4 & Mat.Fit$X6 > Mat.Fit$X5] <- 6
Pred.Data <- Li.Data[c(1:28,30:41,43:53),]
table(Pred.Data$generosityg,Mat.Fit$pred.val)
```
     0  2  3  6
  0  6  7  0  0
  1  5  4  0  0
  2  5 12  1  0
  3  1  2  4  0
  4  0  1  1  0
  5  0  1  0  0
  6  0  0  0  1
So 6+12+4+1 or 23 of 51 are correctly predicted with a rather big and complicated model.
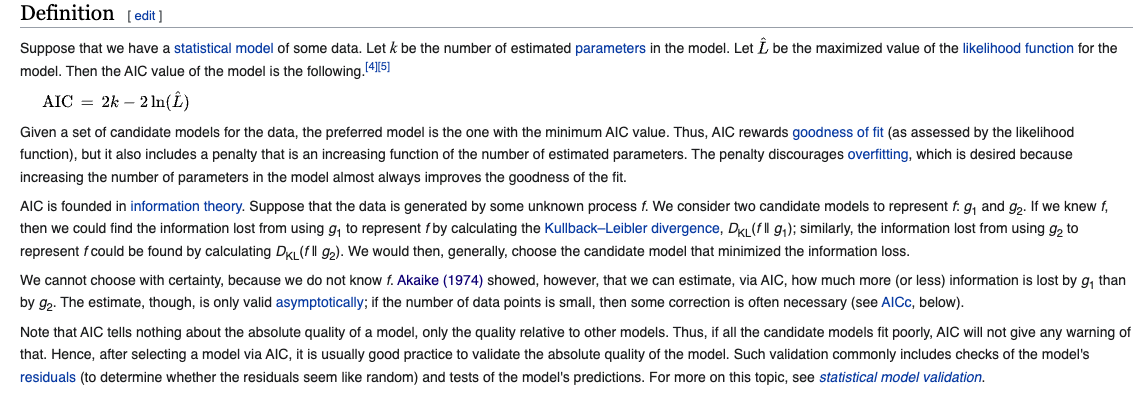
The AIC [and BIC] are built around the idea of likelihood presented last time. The formal definition, which is correct on Wikipedia explains the following:
To examine a hierarchical model, I am going to choose some interesting data on popularity. A description appears below; these data come from an Intro to Multilevel Analysis.
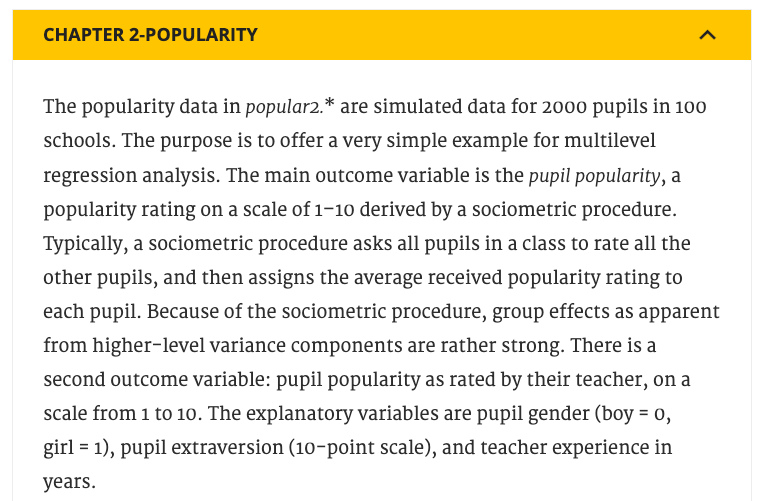
Though the data are technically ordered, this feature is not exploited to build a hierarchical ordered regression model, though it could be done. Instead, the outcome of interest is an average of ordered scales.
```{r}
library(tidyverse)
library(haven)
popular2data <- read_sav(file ="https://github.com/MultiLevelAnalysis/Datasets-third-edition-Multilevel-book/blob/master/chapter%202/popularity/SPSS/popular2.sav?raw=true")
popular2data <- popular2data %>% dplyr::select(pupil, class, extrav, sex, texp, popular)
``` pupil class extrav sex
Min. : 1.00 Min. : 1.00 Min. : 1.000 Min. :0.0000
1st Qu.: 6.00 1st Qu.: 25.00 1st Qu.: 4.000 1st Qu.:0.0000
Median :11.00 Median : 51.00 Median : 5.000 Median :1.0000
Mean :10.65 Mean : 50.37 Mean : 5.215 Mean :0.5055
3rd Qu.:16.00 3rd Qu.: 76.00 3rd Qu.: 6.000 3rd Qu.:1.0000
Max. :26.00 Max. :100.00 Max. :10.000 Max. :1.0000
texp popular
Min. : 2.00 Min. :0.000
1st Qu.: 8.00 1st Qu.:4.100
Median :15.00 Median :5.100
Mean :14.26 Mean :5.076
3rd Qu.:20.00 3rd Qu.:6.000
Max. :25.00 Max. :9.500
# A tibble: 6 × 6
pupil class extrav sex texp popular
<dbl> <dbl> <dbl> <dbl+lbl> <dbl> <dbl>
1 1 1 5 1 [girl] 24 6.3
2 2 1 7 0 [boy] 24 4.9
3 3 1 4 1 [girl] 24 5.3
4 4 1 3 1 [girl] 24 4.7
5 5 1 5 1 [girl] 24 6
6 6 1 4 0 [boy] 24 4.7```{r}
ggplot(data = popular2data,
aes(x = extrav,
y = popular,
col = class))+ #to add the colours for different classes
geom_point(size = 0.8,
alpha = .8,
position = "jitter")+ #to add some random noise for plotting purposes
theme_minimal()+
theme(legend.position = "none")+
scale_color_gradientn(colours = rainbow(100))+
labs(title = "Popularity vs. Extraversion",
subtitle = "add colours for different classes",
x = "Extroversion",
y = "Average Popularity")
```
```{r}
ggplot(data      = popular2data,
       aes(x     = extrav,
           y     = popular,
           col   = class,
           group = class))+ #to add the colours for different classes
  geom_point(size     = 1.2,
             alpha    = .8,
             position = "jitter")+ #to add some random noise for plotting purposes
  theme_minimal()+
  theme(legend.position = "none")+
  scale_color_gradientn(colours = rainbow(100))+
  geom_smooth(method = lm,
              se     = FALSE,
              size   = .5,
              alpha  = .8)+ # to add regression line
  labs(title    = "Popularity vs. Extraversion",
       subtitle = "add colours for different classes and regression lines",
       x = "Extroversion",
       y = "Average Popularity")
```
`geom_smooth()` using formula 'y ~ x'
```{r}
ggplot(data = popular2data,
       aes(x   = extrav,
           y   = popular,
           col = as.factor(sex)))+
  geom_point(size     = 1,
             alpha    = .7,
             position = "jitter")+
  geom_smooth(method   = lm,
              se       = T,
              size     = 1.5,
              linetype = 1,
              alpha    = .7)+
  theme_minimal()+
  labs(title    = "Popularity and Extraversion for 2 Genders",
       subtitle = "The linear relationship between the two is similar for both genders")+
  scale_color_manual(name   =" Gender",
                     labels = c("Boys", "Girls"),
                     values = c("lightblue", "pink"))
```
`geom_smooth()` using formula 'y ~ x'
A model with random intercepts
```{r, warning=FALSE, message=FALSE}
library(lme4)
options(scipen=7)
library(lmerTest)
model1 <- lmer(formula = popular ~ 1 + sex + extrav + (1|class),
               data    = popular2data)
summary(model1)
```
Linear mixed model fit by REML. t-tests use Satterthwaite's method [
lmerModLmerTest]
Formula: popular ~ 1 + sex + extrav + (1 | class)
Data: popular2data
REML criterion at convergence: 4948.3
Scaled residuals:
Min 1Q Median 3Q Max
-3.2091 -0.6575 -0.0044 0.6732 2.9755
Random effects:
Groups Name Variance Std.Dev.
class (Intercept) 0.6272 0.7919
Residual 0.5921 0.7695
Number of obs: 2000, groups: class, 100
Fixed effects:
Estimate Std. Error df t value Pr(>|t|)
(Intercept) 2.14096 0.11729 390.76822 18.25 <2e-16 ***
sex 1.25300 0.03743 1926.69933 33.48 <2e-16 ***
extrav 0.44161 0.01616 1956.77498 27.33 <2e-16 ***
---
Signif. codes: 0 '***' 0.001 '**' 0.01 '*' 0.05 '.' 0.1 ' ' 1
Correlation of Fixed Effects:
(Intr) sex
sex -0.100
extrav -0.705 -0.085Though in this case, we probably do not need them but p-values can be obtained from lmerTest. The standard lme4 summary does not have them.
Now let’s add a second-level predictor. Teacher experience does not vary within a given classroom, only across the 100 classrooms. Let’s look at this model.
```{r}
model2 <- lmer(popular ~ 1 + sex + extrav + texp + (1 | class), data=popular2data)
summary(model2)
```
Linear mixed model fit by REML. t-tests use Satterthwaite's method [
lmerModLmerTest]
Formula: popular ~ 1 + sex + extrav + texp + (1 | class)
Data: popular2data
REML criterion at convergence: 4885
Scaled residuals:
Min 1Q Median 3Q Max
-3.1745 -0.6491 -0.0075 0.6705 3.0078
Random effects:
Groups Name Variance Std.Dev.
class (Intercept) 0.2954 0.5435
Residual 0.5920 0.7694
Number of obs: 2000, groups: class, 100
Fixed effects:
Estimate Std. Error df t value Pr(>|t|)
(Intercept) 0.809766 0.169993 226.431473 4.764 0.0000034 ***
sex 1.253800 0.037290 1948.303018 33.623 < 2e-16 ***
extrav 0.454431 0.016165 1954.889209 28.112 < 2e-16 ***
texp 0.088407 0.008764 101.627424 10.087 < 2e-16 ***
---
Signif. codes: 0 '***' 0.001 '**' 0.01 '*' 0.05 '.' 0.1 ' ' 1
Correlation of Fixed Effects:
(Intr) sex extrav
sex -0.040
extrav -0.589 -0.090
texp -0.802 -0.036 0.139More experienced teachers lead to higher reported average popularity.
```{r, message=FALSE, warning=FALSE}
model3 <- lmer(formula = popular ~ 1 + sex + extrav + texp + (1 + sex + extrav | class),
               data    = popular2data, control=lmerControl(optCtrl=list(maxfun=100000) ))
summary(model3)
```
Linear mixed model fit by REML. t-tests use Satterthwaite's method [
lmerModLmerTest]
Formula: popular ~ 1 + sex + extrav + texp + (1 + sex + extrav | class)
Data: popular2data
Control: lmerControl(optCtrl = list(maxfun = 100000))
REML criterion at convergence: 4833.3
Scaled residuals:
Min 1Q Median 3Q Max
-3.1643 -0.6554 -0.0246 0.6711 2.9570
Random effects:
Groups Name Variance Std.Dev. Corr
class (Intercept) 1.342020 1.15846
sex 0.002404 0.04903 -0.39
extrav 0.034742 0.18639 -0.88 -0.09
Residual 0.551435 0.74259
Number of obs: 2000, groups: class, 100
Fixed effects:
Estimate Std. Error df t value Pr(>|t|)
(Intercept) 0.758511 0.197316 181.050469 3.844 0.000167 ***
sex 1.250810 0.036942 986.050567 33.859 < 2e-16 ***
extrav 0.452854 0.024645 96.208501 18.375 < 2e-16 ***
texp 0.089520 0.008618 101.321705 10.388 < 2e-16 ***
---
Signif. codes: 0 '***' 0.001 '**' 0.01 '*' 0.05 '.' 0.1 ' ' 1
Correlation of Fixed Effects:
(Intr) sex extrav
sex -0.062
extrav -0.718 -0.066
texp -0.684 -0.039 0.089
optimizer (nloptwrap) convergence code: 0 (OK)
Model failed to converge with max|grad| = 0.00597328 (tol = 0.002, component 1)boundary (singular) fit: see help('isSingular')ANOVA-like table for random-effects: Single term deletions
Model:
popular ~ sex + extrav + texp + (1 + sex + extrav | class)
npar logLik AIC LRT Df
<none> 11 -2416.6 4855.3
sex in (1 + sex + extrav | class) 8 -2417.4 4850.8 1.513 3
extrav in (1 + sex + extrav | class) 8 -2441.9 4899.8 50.507 3
Pr(>Chisq)
<none>
sex in (1 + sex + extrav | class) 0.6792
extrav in (1 + sex + extrav | class) 0.00000000006232 ***
---
Signif. codes: 0 '***' 0.001 '**' 0.01 '*' 0.05 '.' 0.1 ' ' 1The random effect associated with sex is not close to significance.
```{r}
model5<-lmer(formula = popular ~ 1 + sex + extrav + texp+ extrav*texp + (1 + extrav | class),
             data    = popular2data)
summary(model5)
```
Linear mixed model fit by REML. t-tests use Satterthwaite's method [
lmerModLmerTest]
Formula: popular ~ 1 + sex + extrav + texp + extrav * texp + (1 + extrav |
class)
Data: popular2data
REML criterion at convergence: 4780.5
Scaled residuals:
Min 1Q Median 3Q Max
-3.12872 -0.63857 -0.01129 0.67916 3.05006
Random effects:
Groups Name Variance Std.Dev. Corr
class (Intercept) 0.478639 0.69184
extrav 0.005409 0.07355 -0.64
Residual 0.552769 0.74348
Number of obs: 2000, groups: class, 100
Fixed effects:
Estimate Std. Error df t value Pr(>|t|)
(Intercept) -1.209607 0.271901 109.345831 -4.449 2.09e-05 ***
sex 1.240698 0.036233 1941.077365 34.243 < 2e-16 ***
extrav 0.803578 0.040117 72.070164 20.031 < 2e-16 ***
texp 0.226197 0.016807 98.507109 13.458 < 2e-16 ***
extrav:texp -0.024728 0.002555 71.986847 -9.679 1.15e-14 ***
---
Signif. codes: 0 '***' 0.001 '**' 0.01 '*' 0.05 '.' 0.1 ' ' 1
Correlation of Fixed Effects:
(Intr) sex extrav texp
sex 0.002
extrav -0.867 -0.065
texp -0.916 -0.047 0.801
extrav:texp 0.773 0.033 -0.901 -0.859```{r}
ggplot(data = popular2data,
aes(x = extrav,
y = popular,
col = as.factor(texp)))+
viridis::scale_color_viridis(discrete = TRUE)+
geom_point(size = .7,
alpha = .8,
position = "jitter")+
geom_smooth(method = lm,
se = FALSE,
size = 1,
alpha = .4)+
theme_minimal()+
labs(title = "Interaction btw. Experience and Extraversion",
subtitle = "The relationship changes",
col = "Years of\nTeacher\nExperience")
````geom_smooth()` using formula 'y ~ x'
A few weeks ago, Jack mentioned the use of principal components as a means for combining collinear variables. There is a more general language for describing models of this sort. The following example will play off of work I am currently finishing up with Elliot Maltz and a co-author.
First, the data.
This is lavaan 0.6-12
lavaan is FREE software! Please report any bugs.There is a ton of data in here. Let me pay particular attention to specific parts we are interested in.
```{r}
names(EMData)[[76]]
table(EMData.Anonymous$...76)
names(EMData)[[77]]
table(EMData.Anonymous$...77)
names(EMData)[[78]]
table(EMData.Anonymous$...78)
names(EMData)[[79]]
table(EMData.Anonymous$...79)
AB <- cfa('Agentic =~ ...76 + ...77 + ...78 + ...79', data=EMData.Anonymous, ordered = TRUE)
```
Warning in lav_model_vcov(lavmodel = lavmodel, lavsamplestats = lavsamplestats, : lavaan WARNING:
The variance-covariance matrix of the estimated parameters (vcov)
does not appear to be positive definite! The smallest eigenvalue
(= 6.642114e-18) is close to zero. This may be a symptom that the
model is not identified.[1] "28. You lack career guidance and support [People in the community expect you to be a leader]"
1 2 3 4 5 6 7
22 18 22 21 12 15 5
[1] "28. You lack career guidance and support [Your community encourages you to achieve individual success]"
1 2 3 4 5 6 7
17 19 26 23 18 10 2
[1] "28. You lack career guidance and support [You are expected to be assertive in your interactions with others]"
1 2 3 4 5 6 7
13 27 27 31 11 4 2
[1] "28. You lack career guidance and support [You are expected to have strong opinions]"
1 2 3 4 5 6 7
11 26 19 31 23 3 2
lavaan 0.6-12 ended normally after 15 iterations
Estimator DWLS
Optimization method NLMINB
Number of model parameters 28
Number of observations 115
Model Test User Model:
Standard Robust
Test Statistic 7.422 21.832
Degrees of freedom 2 2
P-value (Chi-square) 0.024 0.000
Scaling correction factor 0.341
Shift parameter 0.087
simple second-order correction
Model Test Baseline Model:
Test statistic 2486.114 1657.812
Degrees of freedom 6 6
P-value 0.000 0.000
Scaling correction factor 1.501
User Model versus Baseline Model:
Comparative Fit Index (CFI) 0.998 0.988
Tucker-Lewis Index (TLI) 0.993 0.964
Robust Comparative Fit Index (CFI) NA
Robust Tucker-Lewis Index (TLI) NA
Root Mean Square Error of Approximation:
RMSEA 0.154 0.295
90 Percent confidence interval - lower 0.047 0.191
90 Percent confidence interval - upper 0.280 0.412
P-value RMSEA <= 0.05 0.053 0.000
Robust RMSEA NA
90 Percent confidence interval - lower NA
90 Percent confidence interval - upper NA
Standardized Root Mean Square Residual:
SRMR 0.033 0.033
Parameter Estimates:
Standard errors Robust.sem
Information Expected
Information saturated (h1) model Unstructured
Latent Variables:
Estimate Std.Err z-value P(>|z|) Std.lv Std.all
Agentic =~
...76 1.000 0.853 0.853
...77 1.056 0.051 20.773 0.000 0.901 0.901
...78 1.045 0.042 25.093 0.000 0.891 0.891
...79 0.962 0.044 22.041 0.000 0.820 0.820
Intercepts:
Estimate Std.Err z-value P(>|z|) Std.lv Std.all
....76 0.000 0.000 0.000
....77 0.000 0.000 0.000
....78 0.000 0.000 0.000
....79 0.000 0.000 0.000
Agentic 0.000 0.000 0.000
Thresholds:
Estimate Std.Err z-value P(>|z|) Std.lv Std.all
...76|t1 -0.873 0.135 -6.459 0.000 -0.873 -0.873
...76|t2 -0.391 0.121 -3.241 0.001 -0.391 -0.391
...76|t3 0.098 0.118 0.835 0.403 0.098 0.098
...76|t4 0.588 0.125 4.702 0.000 0.588 0.588
...76|t5 0.939 0.138 6.790 0.000 0.939 0.939
...76|t6 1.712 0.207 8.262 0.000 1.712 1.712
...77|t1 -1.046 0.144 -7.264 0.000 -1.046 -1.046
...77|t2 -0.487 0.123 -3.975 0.000 -0.487 -0.487
...77|t3 0.098 0.118 0.835 0.403 0.098 0.098
...77|t4 0.641 0.127 5.062 0.000 0.641 0.641
...77|t5 1.257 0.158 7.948 0.000 1.257 1.257
...77|t6 2.111 0.285 7.411 0.000 2.111 2.111
...78|t1 -1.211 0.155 -7.826 0.000 -1.211 -1.211
...78|t2 -0.391 0.121 -3.241 0.001 -0.391 -0.391
...78|t3 0.209 0.118 1.763 0.078 0.209 0.209
...78|t4 1.046 0.144 7.264 0.000 1.046 1.046
...78|t5 1.624 0.195 8.320 0.000 1.624 1.624
...78|t6 2.111 0.285 7.411 0.000 2.111 2.111
...79|t1 -1.307 0.162 -8.058 0.000 -1.307 -1.307
...79|t2 -0.463 0.122 -3.792 0.000 -0.463 -0.463
...79|t3 -0.033 0.117 -0.279 0.781 -0.033 -0.033
...79|t4 0.695 0.128 5.418 0.000 0.695 0.695
...79|t5 1.712 0.207 8.262 0.000 1.712 1.712
...79|t6 2.111 0.285 7.411 0.000 2.111 2.111
Variances:
Estimate Std.Err z-value P(>|z|) Std.lv Std.all
....76 0.273 0.273 0.273
....77 0.188 0.188 0.188
....78 0.207 0.207 0.207
....79 0.327 0.327 0.327
Agentic 0.727 0.051 14.358 0.000 1.000 1.000
Scales y*:
Estimate Std.Err z-value P(>|z|) Std.lv Std.all
...76 1.000 1.000 1.000
...77 1.000 1.000 1.000
...78 1.000 1.000 1.000
...79 1.000 1.000 1.000```{r}
names(EMData)[[80]]
table(EMData.Anonymous$...80)
names(EMData)[[81]]
table(EMData.Anonymous$...81)
names(EMData)[[84]]
table(EMData.Anonymous$...84)
CB <- cfa('Communal =~ ...80 + ...81 + ...84', data=EMData.Anonymous, ordered = TRUE)
summary(CB, fit.measures = TRUE, standardized = TRUE)
```[1] "28. You lack career guidance and support [You are expected to be unselfish]"
1 2 3 4 5 6 7
5 13 24 25 25 19 4
[1] "28. You lack career guidance and support [In your interactions with others you are expected to consider others opinions over your own]"
1 2 3 4 5 6 7
9 21 32 28 20 4 1
[1] "28. You lack career guidance and support [Your community expects you to put others interests ahead of your own]"
1 2 3 4 5 6 7
12 21 24 25 20 11 2
lavaan 0.6-12 ended normally after 13 iterations
Estimator DWLS
Optimization method NLMINB
Number of model parameters 21
Number of observations 115
Model Test User Model:
Standard Robust
Test Statistic 0.000 0.000
Degrees of freedom 0 0
Model Test Baseline Model:
Test statistic 511.919 427.939
Degrees of freedom 3 3
P-value 0.000 0.000
Scaling correction factor 1.198
User Model versus Baseline Model:
Comparative Fit Index (CFI) 1.000 1.000
Tucker-Lewis Index (TLI) 1.000 1.000
Robust Comparative Fit Index (CFI) NA
Robust Tucker-Lewis Index (TLI) NA
Root Mean Square Error of Approximation:
RMSEA 0.000 0.000
90 Percent confidence interval - lower 0.000 0.000
90 Percent confidence interval - upper 0.000 0.000
P-value RMSEA <= 0.05 NA NA
Robust RMSEA NA
90 Percent confidence interval - lower 0.000
90 Percent confidence interval - upper 0.000
Standardized Root Mean Square Residual:
SRMR 0.000 0.000
Parameter Estimates:
Standard errors Robust.sem
Information Expected
Information saturated (h1) model Unstructured
Latent Variables:
Estimate Std.Err z-value P(>|z|) Std.lv Std.all
Communal =~
...80 1.000 0.823 0.823
...81 0.908 0.078 11.572 0.000 0.747 0.747
...84 0.983 0.083 11.823 0.000 0.808 0.808
Intercepts:
Estimate Std.Err z-value P(>|z|) Std.lv Std.all
....80 0.000 0.000 0.000
....81 0.000 0.000 0.000
....84 0.000 0.000 0.000
Communal 0.000 0.000 0.000
Thresholds:
Estimate Std.Err z-value P(>|z|) Std.lv Std.all
...80|t1 -1.712 0.207 -8.262 0.000 -1.712 -1.712
...80|t2 -1.009 0.142 -7.110 0.000 -1.009 -1.009
...80|t3 -0.345 0.120 -2.872 0.004 -0.345 -0.345
...80|t4 0.209 0.118 1.763 0.078 0.209 0.209
...80|t5 0.842 0.134 6.289 0.000 0.842 0.842
...80|t6 1.815 0.223 8.129 0.000 1.815 1.815
...81|t1 -1.417 0.172 -8.235 0.000 -1.417 -1.417
...81|t2 -0.641 0.127 -5.062 0.000 -0.641 -0.641
...81|t3 0.098 0.118 0.835 0.403 0.098 0.098
...81|t4 0.781 0.131 5.945 0.000 0.781 0.781
...81|t5 1.712 0.207 8.262 0.000 1.712 1.712
...81|t6 2.378 0.369 6.451 0.000 2.378 2.378
...84|t1 -1.257 0.158 -7.948 0.000 -1.257 -1.257
...84|t2 -0.562 0.124 -4.521 0.000 -0.562 -0.562
...84|t3 -0.011 0.117 -0.093 0.926 -0.011 -0.011
...84|t4 0.562 0.124 4.521 0.000 0.562 0.562
...84|t5 1.211 0.155 7.826 0.000 1.211 1.211
...84|t6 2.111 0.285 7.411 0.000 2.111 2.111
Variances:
Estimate Std.Err z-value P(>|z|) Std.lv Std.all
....80 0.323 0.323 0.323
....81 0.443 0.443 0.443
....84 0.347 0.347 0.347
Communal 0.677 0.072 9.442 0.000 1.000 1.000
Scales y*:
Estimate Std.Err z-value P(>|z|) Std.lv Std.all
...80 1.000 1.000 1.000
...81 1.000 1.000 1.000
...84 1.000 1.000 1.000```{r}
names(EMData)[[13]]
table(EMData.Anonymous$...13)
names(EMData)[[14]]
table(EMData.Anonymous$...14)
names(EMData)[[15]]
table(EMData.Anonymous$...15)
M <- cfa('Mentoring =~ ...13 + ...14 + ...15', data=EMData.Anonymous, ordered = TRUE)
summary(M, fit.measures = TRUE, standardized = TRUE)
```[1] "5. On a scale of 7 to 1, with 7 being very regularly and 1 being very rarely, how regularly do you: [Encourage entrepreneurs to start businesses]"
1 2 3 4 5 6 7
21 27 12 14 10 26 5
[1] "5. On a scale of 7 to 1, with 7 being very regularly and 1 being very rarely, how regularly do you: [Reassure other entrepreneurs when things are not going well]"
1 2 3 4 5 6 7
22 21 10 19 33 4 6
[1] "5. On a scale of 7 to 1, with 7 being very regularly and 1 being very rarely, how regularly do you: [Help other entrepreneurs have confidence they can succeed]"
1 2 3 4 5 6 7
21 29 27 11 21 5 1
lavaan 0.6-12 ended normally after 10 iterations
Estimator DWLS
Optimization method NLMINB
Number of model parameters 21
Number of observations 115
Model Test User Model:
Standard Robust
Test Statistic 0.000 0.000
Degrees of freedom 0 0
Model Test Baseline Model:
Test statistic 1726.590 1624.559
Degrees of freedom 3 3
P-value 0.000 0.000
Scaling correction factor 1.063
User Model versus Baseline Model:
Comparative Fit Index (CFI) 1.000 1.000
Tucker-Lewis Index (TLI) 1.000 1.000
Robust Comparative Fit Index (CFI) NA
Robust Tucker-Lewis Index (TLI) NA
Root Mean Square Error of Approximation:
RMSEA 0.000 0.000
90 Percent confidence interval - lower 0.000 0.000
90 Percent confidence interval - upper 0.000 0.000
P-value RMSEA <= 0.05 NA NA
Robust RMSEA NA
90 Percent confidence interval - lower 0.000
90 Percent confidence interval - upper 0.000
Standardized Root Mean Square Residual:
SRMR 0.000 0.000
Parameter Estimates:
Standard errors Robust.sem
Information Expected
Information saturated (h1) model Unstructured
Latent Variables:
Estimate Std.Err z-value P(>|z|) Std.lv Std.all
Mentoring =~
...13 1.000 0.981 0.981
...14 0.879 0.058 15.193 0.000 0.862 0.862
...15 0.844 0.056 15.063 0.000 0.827 0.827
Intercepts:
Estimate Std.Err z-value P(>|z|) Std.lv Std.all
....13 0.000 0.000 0.000
....14 0.000 0.000 0.000
....15 0.000 0.000 0.000
Mentoring 0.000 0.000 0.000
Thresholds:
Estimate Std.Err z-value P(>|z|) Std.lv Std.all
...13|t1 -0.905 0.137 -6.626 0.000 -0.905 -0.905
...13|t2 -0.209 0.118 -1.763 0.078 -0.209 -0.209
...13|t3 0.055 0.117 0.464 0.643 0.055 0.055
...13|t4 0.368 0.120 3.057 0.002 0.368 0.368
...13|t5 0.614 0.126 4.882 0.000 0.614 0.614
...13|t6 1.712 0.207 8.262 0.000 1.712 1.712
...14|t1 -0.873 0.135 -6.459 0.000 -0.873 -0.873
...14|t2 -0.322 0.120 -2.688 0.007 -0.322 -0.322
...14|t3 -0.098 0.118 -0.835 0.403 -0.098 -0.098
...14|t4 0.322 0.120 2.688 0.007 0.322 0.322
...14|t5 1.360 0.167 8.155 0.000 1.360 1.360
...14|t6 1.624 0.195 8.320 0.000 1.624 1.624
...15|t1 -0.905 0.137 -6.626 0.000 -0.905 -0.905
...15|t2 -0.164 0.118 -1.392 0.164 -0.164 -0.164
...15|t3 0.439 0.122 3.608 0.000 0.439 0.439
...15|t4 0.723 0.129 5.595 0.000 0.723 0.723
...15|t5 1.624 0.195 8.320 0.000 1.624 1.624
...15|t6 2.378 0.369 6.451 0.000 2.378 2.378
Variances:
Estimate Std.Err z-value P(>|z|) Std.lv Std.all
....13 0.039 0.039 0.039
....14 0.258 0.258 0.258
....15 0.315 0.315 0.315
Mentoring 0.961 0.077 12.508 0.000 1.000 1.000
Scales y*:
Estimate Std.Err z-value P(>|z|) Std.lv Std.all
...13 1.000 1.000 1.000
...14 1.000 1.000 1.000
...15 1.000 1.000 1.000Now let me combine those measurement models to produce a set of two structural equations. I wish to explain income and employment given these factors.
```{r, warning=FALSE, message=FALSE}
names(EMData)[c(5,59)]
Struct <- sem('Agentic =~ ...76 + ...77 + ...78 + ...79
          Communal =~ ...80 + ...81 + ...84
          Mentoring =~ ...13 + ...14 + ...15
          Social.Influence =~ ...37 + ...38 + ...39
          ...59 ~ Agentic + Communal + Mentoring + Social.Influence
          ...5 ~ Agentic + Communal + Mentoring + Social.Influence', data=EMData.Anonymous, ordered = c("...13","...14", "...15", "...80","...81", "...84", "...76","...77", "...78", "...79","...37", "...38", "...39"))
summary(Struct, fit.measures=TRUE, standardized=TRUE)
```
[1] "3. What is the current income generated from the business? (USD PM)"
[2] "20. How many people do you manage in your business?"
lavaan 0.6-12 ended normally after 112 iterations
Estimator DWLS
Optimization method NLMINB
Number of model parameters 108
Number of observations 115
Model Test User Model:
Standard Robust
Test Statistic 176.253 255.843
Degrees of freedom 77 77
P-value (Chi-square) 0.000 0.000
Scaling correction factor 0.804
Shift parameter 36.682
simple second-order correction
Model Test Baseline Model:
Test statistic 9489.339 3694.019
Degrees of freedom 105 105
P-value 0.000 0.000
Scaling correction factor 2.615
User Model versus Baseline Model:
Comparative Fit Index (CFI) 0.989 0.950
Tucker-Lewis Index (TLI) 0.986 0.932
Robust Comparative Fit Index (CFI) NA
Robust Tucker-Lewis Index (TLI) NA
Root Mean Square Error of Approximation:
RMSEA 0.106 0.143
90 Percent confidence interval - lower 0.086 0.124
90 Percent confidence interval - upper 0.127 0.162
P-value RMSEA <= 0.05 0.000 0.000
Robust RMSEA NA
90 Percent confidence interval - lower NA
90 Percent confidence interval - upper NA
Standardized Root Mean Square Residual:
SRMR 0.075 0.075
Parameter Estimates:
Standard errors Robust.sem
Information Expected
Information saturated (h1) model Unstructured
Latent Variables:
Estimate Std.Err z-value P(>|z|) Std.lv Std.all
Agentic =~
...76 1.000 0.812 0.812
...77 1.110 0.051 21.573 0.000 0.901 0.901
...78 1.076 0.044 24.545 0.000 0.873 0.873
...79 1.097 0.047 23.283 0.000 0.890 0.890
Communal =~
...80 1.000 0.715 0.715
...81 1.233 0.126 9.803 0.000 0.881 0.881
...84 1.103 0.091 12.190 0.000 0.788 0.788
Mentoring =~
...13 1.000 0.961 0.961
...14 0.908 0.057 15.897 0.000 0.872 0.872
...15 0.876 0.054 16.228 0.000 0.842 0.842
Social.Influence =~
...37 1.000 0.948 0.948
...38 1.004 0.030 33.882 0.000 0.952 0.952
...39 0.941 0.029 32.029 0.000 0.892 0.892
Regressions:
Estimate Std.Err z-value P(>|z|) Std.lv Std.all
...59 ~
Agentic -0.087 0.063 -1.386 0.166 -0.071 -0.052
Communal 0.119 0.108 1.100 0.271 0.085 0.062
Mentoring 0.166 0.075 2.213 0.027 0.159 0.116
Social.Influnc -0.422 0.055 -7.620 0.000 -0.400 -0.292
...5 ~
Agentic 51.893 19.705 2.633 0.008 42.118 0.205
Communal -9.427 20.599 -0.458 0.647 -6.736 -0.033
Mentoring 1.218 15.046 0.081 0.935 1.170 0.006
Social.Influnc 35.014 16.427 2.131 0.033 33.195 0.161
Covariances:
Estimate Std.Err z-value P(>|z|) Std.lv Std.all
Agentic ~~
Communal 0.259 0.044 5.821 0.000 0.447 0.447
Mentoring 0.203 0.062 3.269 0.001 0.261 0.261
Social.Influnc 0.247 0.056 4.423 0.000 0.321 0.321
Communal ~~
Mentoring 0.134 0.057 2.329 0.020 0.195 0.195
Social.Influnc 0.308 0.062 4.963 0.000 0.454 0.454
Mentoring ~~
Social.Influnc 0.067 0.074 0.904 0.366 0.074 0.074
....59 ~~
....5 78.509 19.599 4.006 0.000 78.509 0.304
Intercepts:
Estimate Std.Err z-value P(>|z|) Std.lv Std.all
....76 0.000 0.000 0.000
....77 0.000 0.000 0.000
....78 0.000 0.000 0.000
....79 0.000 0.000 0.000
....80 0.000 0.000 0.000
....81 0.000 0.000 0.000
....84 0.000 0.000 0.000
....13 0.000 0.000 0.000
....14 0.000 0.000 0.000
....15 0.000 0.000 0.000
....37 0.000 0.000 0.000
....38 0.000 0.000 0.000
....39 0.000 0.000 0.000
....59 0.435 0.305 1.427 0.154 0.435 0.317
....5 380.609 23.778 16.007 0.000 380.609 1.849
Agentic 0.000 0.000 0.000
Communal 0.000 0.000 0.000
Mentoring 0.000 0.000 0.000
Social.Influnc 0.000 0.000 0.000
Thresholds:
Estimate Std.Err z-value P(>|z|) Std.lv Std.all
...76|t1 -0.873 0.135 -6.459 0.000 -0.873 -0.873
...76|t2 -0.391 0.121 -3.241 0.001 -0.391 -0.391
...76|t3 0.098 0.118 0.835 0.403 0.098 0.098
...76|t4 0.588 0.125 4.702 0.000 0.588 0.588
...76|t5 0.939 0.138 6.790 0.000 0.939 0.939
...76|t6 1.712 0.207 8.262 0.000 1.712 1.712
...77|t1 -1.046 0.144 -7.264 0.000 -1.046 -1.046
...77|t2 -0.487 0.123 -3.975 0.000 -0.487 -0.487
...77|t3 0.098 0.118 0.835 0.403 0.098 0.098
...77|t4 0.641 0.127 5.062 0.000 0.641 0.641
...77|t5 1.257 0.158 7.948 0.000 1.257 1.257
...77|t6 2.111 0.285 7.411 0.000 2.111 2.111
...78|t1 -1.211 0.155 -7.826 0.000 -1.211 -1.211
...78|t2 -0.391 0.121 -3.241 0.001 -0.391 -0.391
...78|t3 0.209 0.118 1.763 0.078 0.209 0.209
...78|t4 1.046 0.144 7.264 0.000 1.046 1.046
...78|t5 1.624 0.195 8.320 0.000 1.624 1.624
...78|t6 2.111 0.285 7.411 0.000 2.111 2.111
...79|t1 -1.307 0.162 -8.058 0.000 -1.307 -1.307
...79|t2 -0.463 0.122 -3.792 0.000 -0.463 -0.463
...79|t3 -0.033 0.117 -0.279 0.781 -0.033 -0.033
...79|t4 0.695 0.128 5.418 0.000 0.695 0.695
...79|t5 1.712 0.207 8.262 0.000 1.712 1.712
...79|t6 2.111 0.285 7.411 0.000 2.111 2.111
...80|t1 -1.712 0.207 -8.262 0.000 -1.712 -1.712
...80|t2 -1.009 0.142 -7.110 0.000 -1.009 -1.009
...80|t3 -0.345 0.120 -2.872 0.004 -0.345 -0.345
...80|t4 0.209 0.118 1.763 0.078 0.209 0.209
...80|t5 0.842 0.134 6.289 0.000 0.842 0.842
...80|t6 1.815 0.223 8.129 0.000 1.815 1.815
...81|t1 -1.417 0.172 -8.235 0.000 -1.417 -1.417
...81|t2 -0.641 0.127 -5.062 0.000 -0.641 -0.641
...81|t3 0.098 0.118 0.835 0.403 0.098 0.098
...81|t4 0.781 0.131 5.945 0.000 0.781 0.781
...81|t5 1.712 0.207 8.262 0.000 1.712 1.712
...81|t6 2.378 0.369 6.451 0.000 2.378 2.378
...84|t1 -1.257 0.158 -7.948 0.000 -1.257 -1.257
...84|t2 -0.562 0.124 -4.521 0.000 -0.562 -0.562
...84|t3 -0.011 0.117 -0.093 0.926 -0.011 -0.011
...84|t4 0.562 0.124 4.521 0.000 0.562 0.562
...84|t5 1.211 0.155 7.826 0.000 1.211 1.211
...84|t6 2.111 0.285 7.411 0.000 2.111 2.111
...13|t1 -0.905 0.137 -6.626 0.000 -0.905 -0.905
...13|t2 -0.209 0.118 -1.763 0.078 -0.209 -0.209
...13|t3 0.055 0.117 0.464 0.643 0.055 0.055
...13|t4 0.368 0.120 3.057 0.002 0.368 0.368
...13|t5 0.614 0.126 4.882 0.000 0.614 0.614
...13|t6 1.712 0.207 8.262 0.000 1.712 1.712
...14|t1 -0.873 0.135 -6.459 0.000 -0.873 -0.873
...14|t2 -0.322 0.120 -2.688 0.007 -0.322 -0.322
...14|t3 -0.098 0.118 -0.835 0.403 -0.098 -0.098
...14|t4 0.322 0.120 2.688 0.007 0.322 0.322
...14|t5 1.360 0.167 8.155 0.000 1.360 1.360
...14|t6 1.624 0.195 8.320 0.000 1.624 1.624
...15|t1 -0.905 0.137 -6.626 0.000 -0.905 -0.905
...15|t2 -0.164 0.118 -1.392 0.164 -0.164 -0.164
...15|t3 0.439 0.122 3.608 0.000 0.439 0.439
...15|t4 0.723 0.129 5.595 0.000 0.723 0.723
...15|t5 1.624 0.195 8.320 0.000 1.624 1.624
...15|t6 2.378 0.369 6.451 0.000 2.378 2.378
...37|t1 -0.752 0.130 -5.771 0.000 -0.752 -0.752
...37|t2 0.142 0.118 1.207 0.228 0.142 0.142
...37|t3 0.939 0.138 6.790 0.000 0.939 0.939
...37|t4 1.124 0.149 7.558 0.000 1.124 1.124
...37|t5 1.548 0.186 8.325 0.000 1.548 1.548
...38|t1 -0.723 0.129 -5.595 0.000 -0.723 -0.723
...38|t2 0.209 0.118 1.763 0.078 0.209 0.209
...38|t3 0.939 0.138 6.790 0.000 0.939 0.939
...38|t4 1.166 0.152 7.696 0.000 1.166 1.166
...38|t5 1.548 0.186 8.325 0.000 1.548 1.548
...39|t1 -0.641 0.127 -5.062 0.000 -0.641 -0.641
...39|t2 0.231 0.119 1.948 0.051 0.231 0.231
...39|t3 1.046 0.144 7.264 0.000 1.046 1.046
...39|t4 1.211 0.155 7.826 0.000 1.211 1.211
...39|t5 1.624 0.195 8.320 0.000 1.624 1.624
...39|t6 2.378 0.369 6.451 0.000 2.378 2.378
Variances:
Estimate Std.Err z-value P(>|z|) Std.lv Std.all
....76 0.341 0.341 0.341
....77 0.188 0.188 0.188
....78 0.238 0.238 0.238
....79 0.207 0.207 0.207
....80 0.489 0.489 0.489
....81 0.224 0.224 0.224
....84 0.378 0.378 0.378
....13 0.077 0.077 0.077
....14 0.239 0.239 0.239
....15 0.292 0.292 0.292
....37 0.101 0.101 0.101
....38 0.094 0.094 0.094
....39 0.204 0.204 0.204
....59 1.711 0.147 11.666 0.000 1.711 0.910
....5 38984.352 4516.263 8.632 0.000 38984.352 0.920
Agentic 0.659 0.048 13.761 0.000 1.000 1.000
Communal 0.511 0.068 7.492 0.000 1.000 1.000
Mentoring 0.923 0.072 12.824 0.000 1.000 1.000
Social.Influnc 0.899 0.033 27.070 0.000 1.000 1.000
Scales y*:
Estimate Std.Err z-value P(>|z|) Std.lv Std.all
...76 1.000 1.000 1.000
...77 1.000 1.000 1.000
...78 1.000 1.000 1.000
...79 1.000 1.000 1.000
...80 1.000 1.000 1.000
...81 1.000 1.000 1.000
...84 1.000 1.000 1.000
...13 1.000 1.000 1.000
...14 1.000 1.000 1.000
...15 1.000 1.000 1.000
...37 1.000 1.000 1.000
...38 1.000 1.000 1.000
...39 1.000 1.000 1.000
Social Influence