When the first bits of efficacy on the Pfizer/BioNTech vaccine were released, this provides an excellent example for analysis using the binomial. The blog post from phastar is here.
A Quick and Dirty Vaccine Analysis: Initial Trials
Last November, we got the first formal data with very encouraging news regarding the efficacy of the Pfizer/BioNTech COVID-19 vaccine. A thorough and interesting description of the study can be found on phastar. Using supplemental data from the blog post (I had not seen these key data details elsewhere), we can more fully understand what talk of vaccine efficacy means. I should also their use of 95% is something embedded in the study protocol.
The trial is a two-armed trial with equal numbers in the vaccine and placebo groups. The total sample is 43,538 with 21769 in each arm. Moveover, we learn that of 94 COVID cases, there were 8 in the vaccine group and 86 in the placebo group. Disease condition is yes/no, repeated in identical trials for the two groups, to yield the following two exact binomial analyses. First, let us examine the vaccinated groups.
# The Vaccinated Groupbinom.test(8, 21769)
    Exact binomial test

data:  8 and 21769
number of successes = 8, number of trials = 21769, p-value < 2.2e-16
alternative hypothesis: true probability of success is not equal to 0.5
95 percent confidence interval:
 0.0001586712 0.0007239827
sample estimates:
probability of success
          0.0003674951
In the vaccinated group, the probability of infection, with 95% confidence/probability, is estimated to range from 0.000159 to 0.000724. 1.6 to 7.2 in 10,000. What about the unvaccinated group?
# The Placebo Groupbinom.test(86, 21769)
    Exact binomial test

data:  86 and 21769
number of successes = 86, number of trials = 21769, p-value < 2.2e-16
alternative hypothesis: true probability of success is not equal to 0.5
95 percent confidence interval:
 0.003161126 0.004876658
sample estimates:
probability of success
           0.003950572
In the placebo group, the probability of infection, with 95% confidence/probability, is estimated to range from 0.0032 to 0.0049. That’s somewhere between 32 and 49 in 10,000. The smallest probability for the placebo group is 0.0032 while the largest probability for the vaccinated group is 0.000724. The ratio is over 4.4 meaning you are at least 4.4 times more likely to be infected if unvaccinated, though the circulating variants and their frequency were quite different one year ago.
As the article suggests, the standard measure of interest is vaccine efficacy; it is measured as \[
VE = \frac{Pr(Infection|Placebo) - Pr(Infection|Vaccine)}{Pr(Infection|Placebo)}
\]
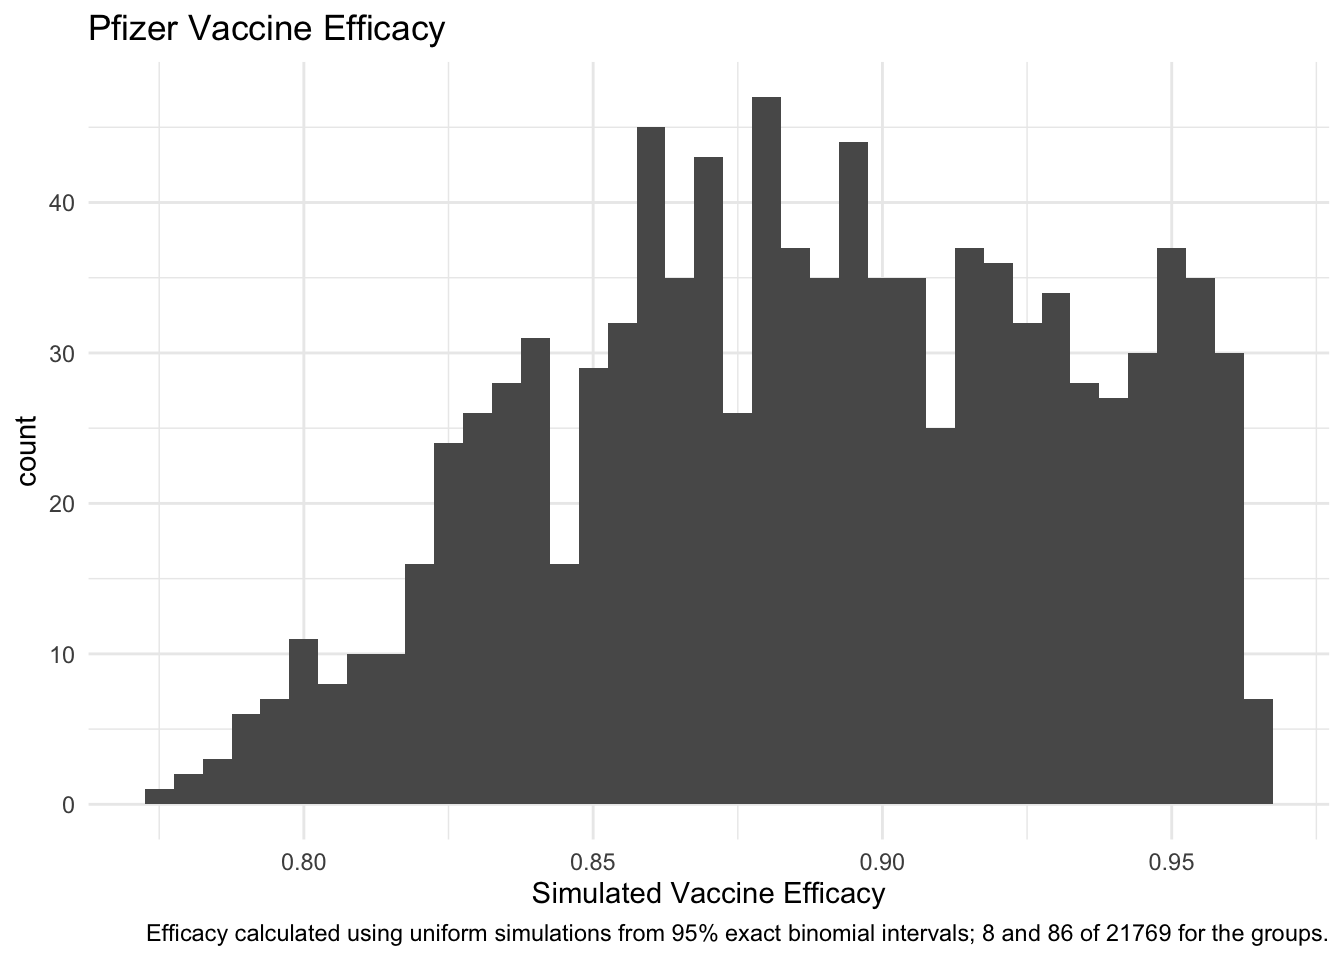
With the two intervals above, we have intervals for each of the two quantities in the calculation. What I do not know is what we might assume as a distribution for the confidence interval. Because it is two-sided, a uniform doesn’t seem entirely unreasonable and should at least well constitute bounds on effectiveness if not rendering an appropriate shape.
Let me use a very basic Monte Carlo simulation to work through it. I will first generate random probabilities between the two ends of the confidence interval for the No.Vaccine group and then do the same thing for the Vaccine group.