library(tidyverse)
library(DT)
mtcars %>% datatable()Colors and DT::Datatable
DT::datatable is a wonderful tool for tables with many neat features. Styling them can be tricky, especially on a webpage. Let me show an example using the mtcars data.
This example looks fine because of the theme that is used in deploying this particular website. But that is not always true. Using the bootstrap theme darkly, the above table looks like this.
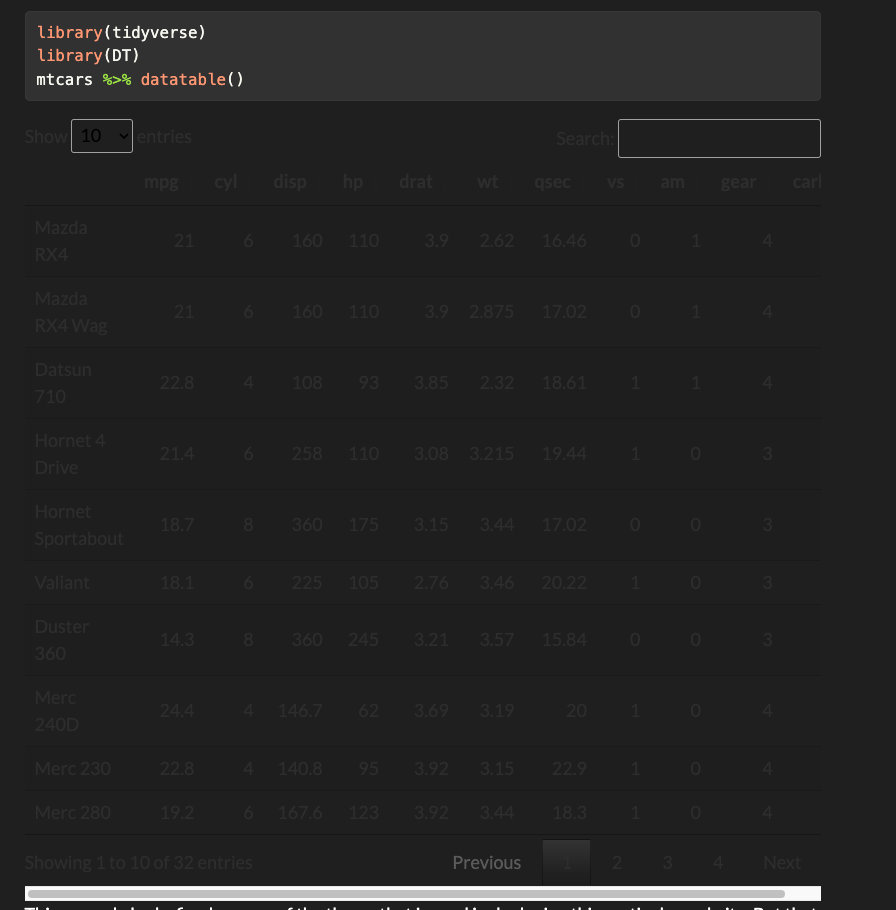
It is very hard to read. Supposing that I was committed to a darkly theme, how could I fix the table? That’s the task though I will start with some colors for it.
Pigeons for a palette
My favorite color palette originated with a pigeon. Here is the palette.
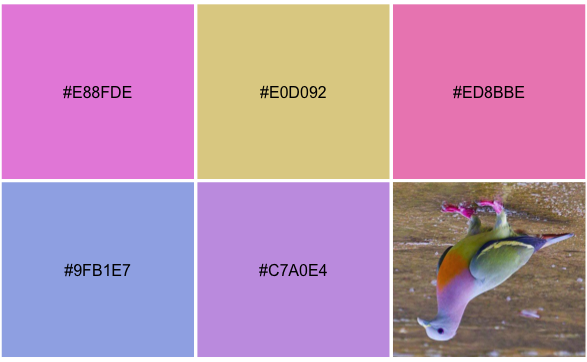
I have five colors to use from this which is exactly what I require. If you need to find colors and their associated hex codes, ask a search engine for hex color wheel.
Modifying elements of the datatable
There seem to be four elements that can be adjusted, or at least these are the four that I have located in the documents.
- main table background: the cell background. These can be adjusted on a column-by-column basis. This will also enable us to treat the row names as a separate column.
- the header background for the column names.
- the container background for the controls.
Let me first pull up the help file for ?formatStyle and see how far that will get me.
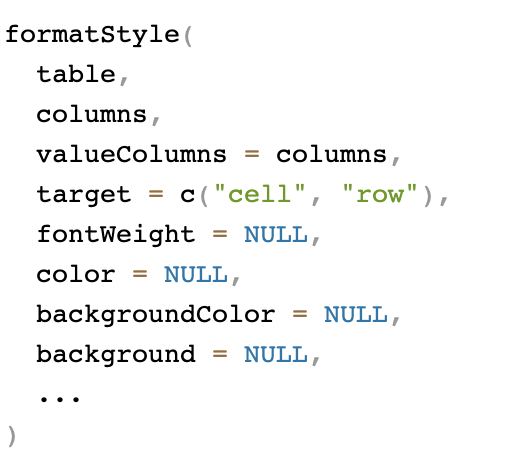
The help makes clear that coloring the background [in either of two ways, it is not clear that background and backgroundColor do not do exactly the same thing.
Adjusting the cell background
I want to use the ecruish color: #E0D092 for the background of all the cells; this can be varied on a column by column basis using the quoted name of the column. Here, I will use the names function to do them all.
mtcars %>%
  datatable() %>%
  formatStyle(names(mtcars), background = "#E0D092")
Note
It seems that background and backgroundColor do exactly the same thing. Taking the following example, they appear to but background overrides backgroundColor.
mtcars %>%
  datatable() %>%
  formatStyle(names(mtcars), backgroundColor = "#E0D092",  background = "#000000") %>%
# Keep the backgroundColor argument and
  formatStyle(c("cyl","hp"), background = "white")
Coloring by columns
Though I don’t want to keep the following change, to change one column by itself, I can name it and give it a color.
Or we can address them with numbers.
mtcars %>%
  datatable() %>%
  formatStyle(names(mtcars), background = "#E0D092") %>%
  formatStyle(c("cyl","hp"), background = "white") %>%
  formatStyle(c(1,3,5,7), background = "red")
This is hideous but is only intended for explanation purposes. Now let’s adjust the row names to accord with the pigeon palette by making the row names the neat periwinkle color from the palette.
mtcars %>%
  datatable() %>%
  formatStyle(names(mtcars), background = "#E0D092") %>%
  formatStyle(0, background = "#9FB1E7")
This looks ok. Now let me turn to two other adjustments. These are a bit more difficult.
Adjusting the column names – header
Adjusting the column names requires that we get into the table’s api. The relevant part of the api for the column headers resides in table.header(). I will turn the table.header() into the dark salmon color from the palette: #ED8BBE. This requires an adjustment of the options in the original datatable configuration. This information was buried deep in the documents. There is a lot of stuff in there though mostly it involves going to the original Datatables in javascript documentation and poking about.
mtcars %>%
  datatable(., options = list(
  initComplete = JS(
    "function(settings, json) {",
    "$(this.api().table().header()).css({'background-color': '#ED8BBE'});",
    "}")
    )
  ) %>%
  formatStyle(names(mtcars), background = "#E0D092") %>%
  formatStyle(0, background = "#9FB1E7")
That completes three of the four elements that I wish to adjust. Now it is time to adjust the containers in which the table resides that holds the navigation.
Adjusting the container
The container in which the table resides can also be adjusted using the API. I want to turn it into the brighter pink: #E88FDE. The code is similar to what was previously adjusted, only the name differs.
mtcars %>%
  datatable(., options = list(
  initComplete = JS(
    "function(settings, json) {",
    "$(this.api().table().header()).css({'background-color': '#ED8BBE'});",
    "$(this.api().table().container()).css({'background-color': '#E8BFDE'});",
    "}")
    )
  ) %>%
  formatStyle(names(mtcars), background = "#E0D092") %>%
  formatStyle(0, background = "#9FB1E7")
This is a rather complete characterization of background color control in DT::datatable. Now let me turn to other elements.
Formatting the text in cells and row names
Going back to the help, there is a color argument that will control the color of the text. Let me try white [#FFFFFF] to make sure.
mtcars %>%
  datatable(., options = list(
  initComplete = JS(
    "function(settings, json) {",
    "$(this.api().table().header()).css({'background-color': '#ED8BBE'});",
    "$(this.api().table().container()).css({'background-color': '#E8BFDE'});",
    "}")
    )
  ) %>%
  formatStyle(names(mtcars), background = "#E0D092", color="#FFFFFF") %>%
  formatStyle(0, backgroundColor = "#9FB1E7", color="#FFFFFF")
So far so good. The styleInterval option allows us more control over this by allowing something akin to a color legend for cell coloring. For example, let’s use cylinders – cyl. I will cut it into the three distinct values, since they are 4, 6, and 8 and the argument is cutpoints, any number between 4 and 6 for the first and 6 and 8 for the second will suffice.
mtcars %>%
  datatable(., options = list(
  initComplete = JS(
    "function(settings, json) {",
    "$(this.api().table().header()).css({'background-color': '#ED8BBE'});",
    "$(this.api().table().container()).css({'background-color': '#E8BFDE'});",
    "}")
    )
  ) %>%
  formatStyle(names(mtcars), background = "#E0D092", color="#FFFFFF") %>%
  formatStyle("cyl", background = "#E0D092", color=styleInterval(c(5,7), c("red","blue","green"))) %>%
  formatStyle(0, backgroundColor = "#9FB1E7", color="#FFFFFF")
There is a great deal that can be done with that.
Formatting the container and the header
The arguments to create json for the header and container can be altered in a similar fashion. I will copy the lines for the background-color and use those to manipulate the individual text entries with color.
mtcars %>%
  datatable(., options = list(
  initComplete = JS(
    "function(settings, json) {",
    "$(this.api().table().header()).css({'background-color': '#ED8BBE', 'color': '#FFFFFF'});",
    "$(this.api().table().container()).css({'background-color': '#E8BFDE', 'color': '#FFFFFF'});",
    "}")
    )
  ) %>%
  formatStyle(names(mtcars), background = "#E0D092", color="#FFFFFF") %>%
  formatStyle("cyl", background = "#E0D092", color=styleInterval(c(5,7), c("red","blue","green"))) %>%
  formatStyle(0, backgroundColor = "#9FB1E7", color="#FFFFFF")
I make no claim that this is a pretty table but the intent is to show how to manipulate colors. This seems to be a pretty complete rendition. With that, let me let the pigeon’s colors finish it off. I am going to switch up an initial bad choice and make all the text ecru because it has the highest contrast.
callback <- c(
  "$('#DataTables_Table_10_length').css('color', 'blue');",
  "$('#DataTables_Table_10_length').css('background-color', 'purple');",
  "$('#DataTables_Table_10_filter').css('color', 'green');",
  "$('#DataTables_Table_10_filter').css('background-color', 'purple');",
  "$('#DataTables_Table_10_length select').css('color', 'red');",
  "$('#DataTables_Table_10_length select').css('background-color', 'brown');",
  "$('#DataTables_Table_10_filter input').css('color', 'red');",
  "$('#DataTables_Table_10_filter input').css('background-color', 'brown');",
  "$('#DataTables_Table_10_info').css('color', 'purple');",
  "$('#DataTables_Table_10_paginate').css('background-color', 'yellow');"
  )
mtcars %>%
  datatable(., callback = JS(callback), options = list(
  initComplete = JS(
    "function(settings, json) {",
    "$(this.api().table().header()).css({'background-color': '#ED8BBE', 'color': '#E0D092'});",
    "$(this.api().table().container()).css({'background-color': '#ED8BBE', 'color': '#E0D092'});",
    "}")
    )
  ) %>%
  formatStyle(names(mtcars), background = "#C7A0E4", color="#E0D092") %>%
  formatStyle(0, backgroundColor = "#9FB1E7", color="#E0D092")
I cannot, for the life of me, fix the buttons.
mtcars %>%
  datatable(., options = list(
  initComplete = JS(
    "function(settings, json) {",
    "$(this.api().table().header()).css({'background-color': '#ED8BBE', 'color': '#E0D092'});",
    "$(this.api().table().container()).css({'background-color': '#ED8BBE', 'color': '#E0D092'});",
    "$(this.api().table().paginate()).css({'background-color': '#ED8BBE', 'color': '#E0D092'});",
    "}")
    )
  ) %>%
  formatStyle(names(mtcars), background = "#C7A0E4", color="#E0D092") %>%
  formatStyle(0, backgroundColor = "#9FB1E7", color="#E0D092")