The timetk or time toolkit package for R provides a glorious complementary fork to the tsibble adopted in the FPP 3 text [and the preceding forecast package built around fpp2]. If you want to know about time series data types, I cannot stress how useful and complete the vignette on time series coercion that is written intothe documentation for timetk
wrangling
Wrangling is tidy and some of the things that you may have found frustrating about aggregation before may make more sense when shown using this approach. For example, we needed effort to massage daily data on equities, that’s a specific function of the indexing in a daily time series where markets are closed on weekends. Time needs to be redefined. Questions like this get some attention here
condense_period
This function allow you easily aggregate data.frame data with the declaration of a time variable. Elsewhere, I have an example of pivoting data from wide to long. It is very handy.
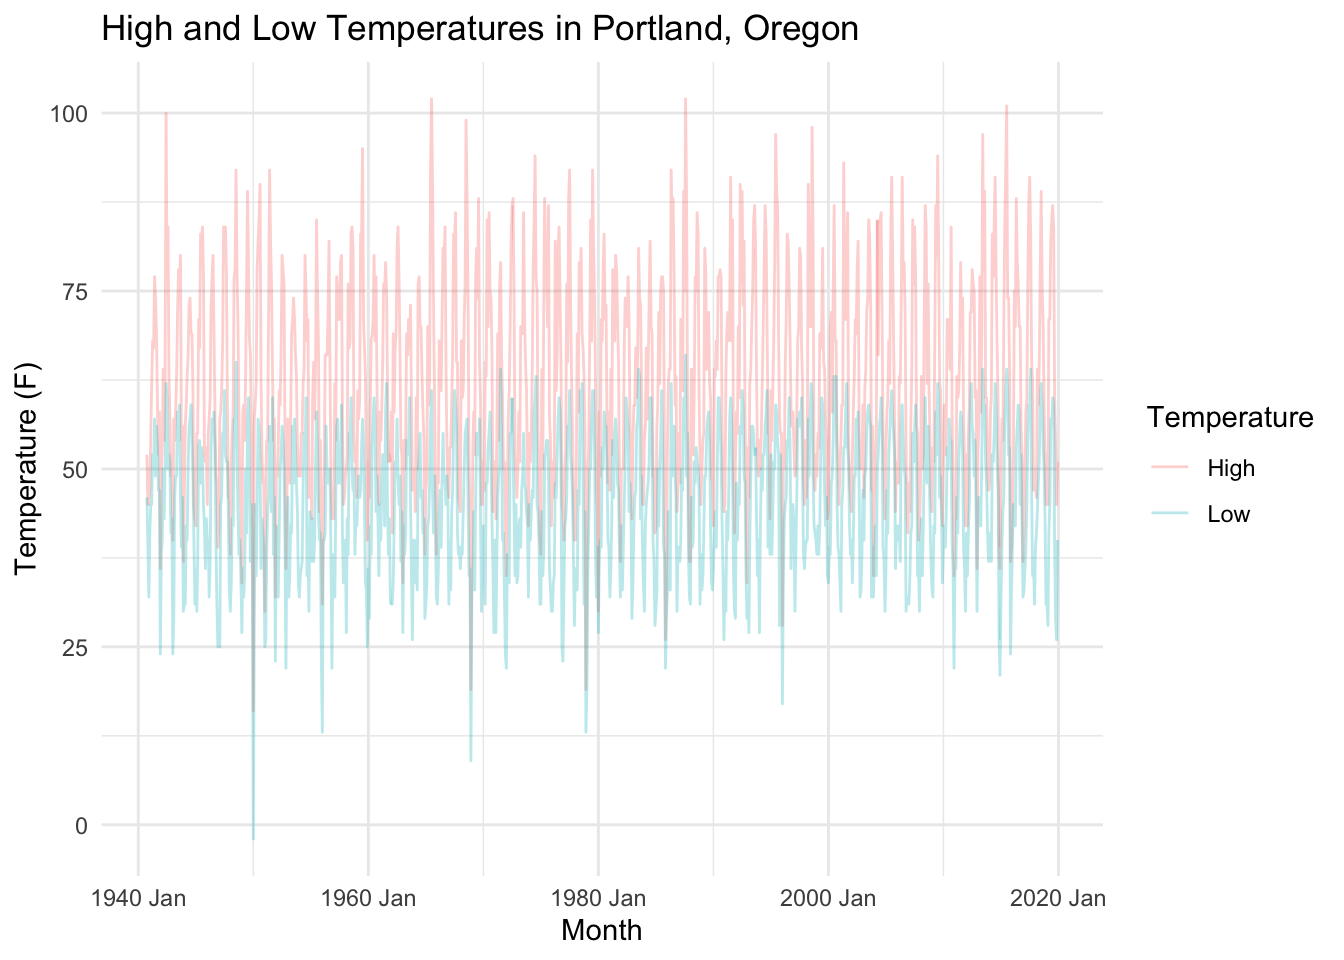
library(tidyverse)NWS <-read.csv(url("https://www.weather.gov/source/pqr/climate/webdata/Portland_dailyclimatedata.csv"), skip=6, na.strings =c("M","-", "")) %>%rename(Variable = X) %>%mutate(across(where(is.character), ~str_remove(.x, "/A"))) %>%filter(!(MO==1& YR==2020))library(magrittr)# I really like the magrittr %<>% pipe for updating data during cleaning# Start the daily dataNWS.Daily <- NWS %>%select(-AVG.or.Total)# Rename the columns because Variable is actually Xnames(NWS.Daily) <-c("YR","MO","Variable",paste0("Day.",1:31))# Create the daily data frame though it contains days that do not actually exist. # Every month nominally has 31 days.NWS.DF <- NWS.Daily %>%pivot_longer(., cols=starts_with("Day."), names_to ="Day", values_to ="value") %>%mutate(Day =str_remove(Day, "Day."))NWS.DF %<>%pivot_wider(., names_from ="Variable", values_from ="value")NWS.DF %<>%mutate(date =as.Date(paste(MO,Day,YR,sep="-"), format="%m-%d-%Y"))NWS.DF$SN[NWS.DF$date==as.Date("1978-12-07")] <-0NWS.DF %<>%mutate(PR =recode(PR, T ="0.005"), SN =recode(SN, T ="0.005")) %>%mutate(High =as.numeric(TX), Low =as.numeric(TN), Precipitation =as.numeric(PR), Snow =as.numeric(SN) ) %>%select(date, High, Low, Precipitation, Snow)library(kableExtra)head(NWS.DF, n=40) %>%kable() %>%scroll_box(width="600px", height="400px")
date
High
Low
Precipitation
Snow
1940-10-01
NA
NA
NA
NA
1940-10-02
NA
NA
NA
NA
1940-10-03
NA
NA
NA
NA
1940-10-04
NA
NA
NA
NA
1940-10-05
NA
NA
NA
NA
1940-10-06
NA
NA
NA
NA
1940-10-07
NA
NA
NA
NA
1940-10-08
NA
NA
NA
NA
1940-10-09
NA
NA
NA
NA
1940-10-10
NA
NA
NA
NA
1940-10-11
NA
NA
NA
NA
1940-10-12
NA
NA
NA
NA
1940-10-13
75
57
0.010
0
1940-10-14
70
53
0.005
0
1940-10-15
64
52
0.005
0
1940-10-16
72
50
0.000
0
1940-10-17
72
58
0.130
0
1940-10-18
78
58
0.000
0
1940-10-19
78
59
0.005
0
1940-10-20
64
54
0.140
0
1940-10-21
63
48
0.050
0
1940-10-22
61
41
0.000
0
1940-10-23
58
53
0.630
0
1940-10-24
57
48
1.030
0
1940-10-25
57
41
0.000
0
1940-10-26
57
38
0.000
0
1940-10-27
56
37
0.005
0
1940-10-28
53
45
0.180
0
1940-10-29
59
48
0.580
0
1940-10-30
59
50
0.500
0
1940-10-31
52
46
0.250
0
1940-11-01
52
40
0.170
0
1940-11-02
53
38
0.020
0
1940-11-03
47
36
0.005
0
1940-11-04
55
32
0.000
0
1940-11-05
51
42
0.070
0
1940-11-06
58
46
0.280
0
1940-11-07
56
46
0.850
0
1940-11-08
50
42
0.290
0
1940-11-09
48
35
0.020
0
Aggregating
This would normally be a pain; timetk makes it easy. I want to aggregate them by the last period of whatever month it happens to be.