
Finishing Visualization and Sources of Data
OIS Chapters 1 and 2, Two Links, Grammar of Graphics
The Basics
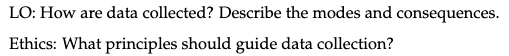
The Dot Plot [it’s really a beeswarm]
Overview
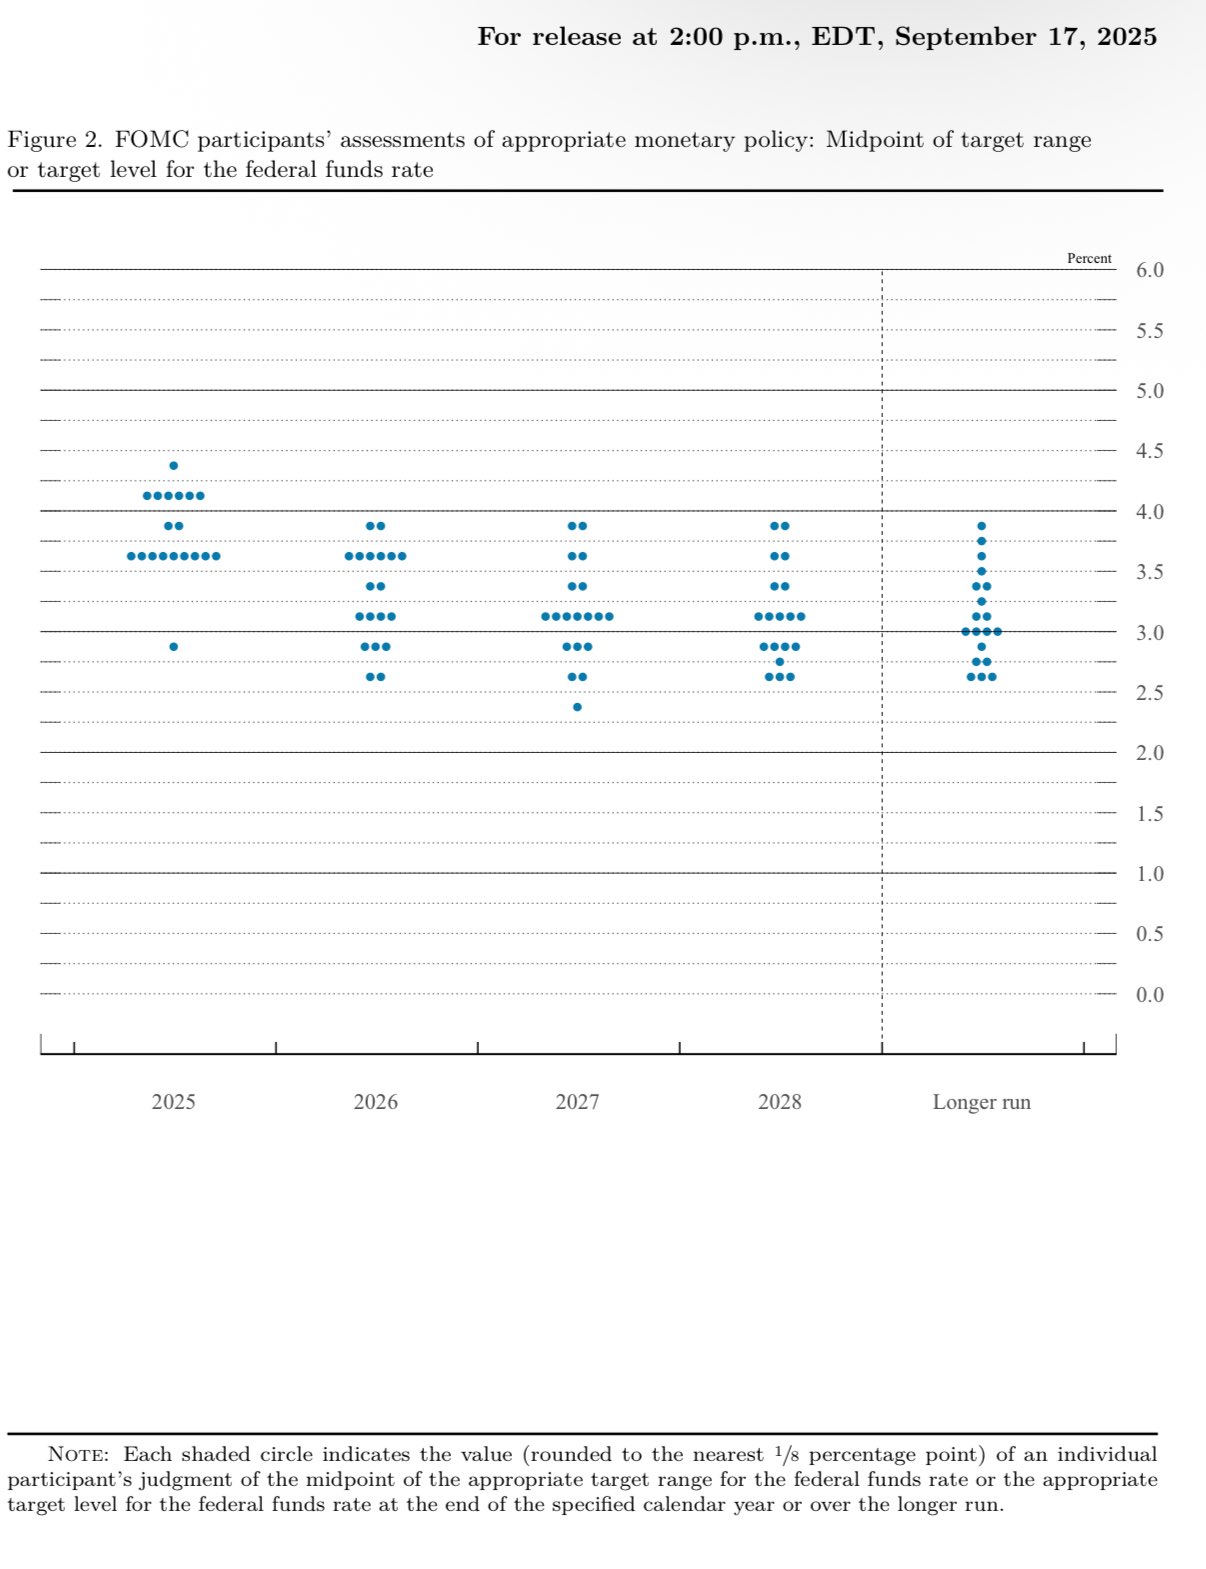
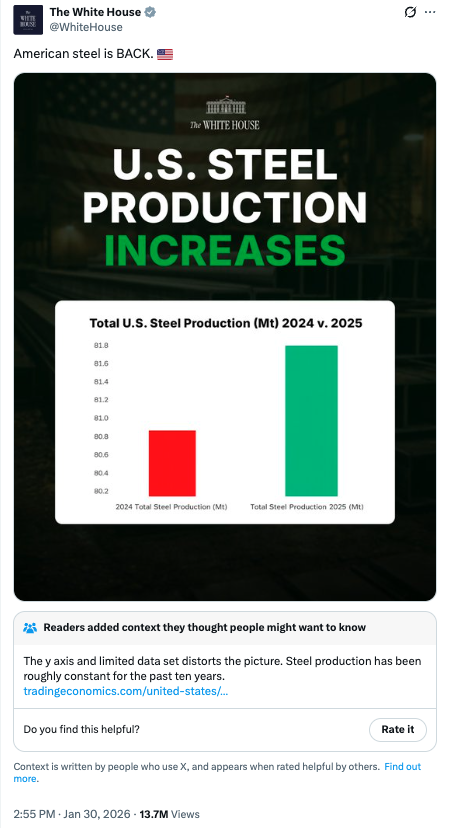
- The Economist: Mistakes
- Tables
- Probability
Scatterplots [Lines just connect points]
Finishing Plots
Important
Prompt: create a scatterplot of returns by assets
Prompt: create a scatterplot of expense ratios and returns with symbols from fees and colors from risk

Important
Prompt: use a checkmark for yes and an X for no as the symbols

plotly
ECDFs and Probability: A Link

Do’s and Dont’s
Where do data come from?
Where do data come from?
What does your book have to say?
Where do data come from?
- Surveys.
- Macroeconomic aggregates.
- Sensors and passive collection.
- Mall intercepts.
Westwood 2025
Bots change the value of survey data.
For Next Time
Read, if you have not already, the CDC Framework, paying particular attention to credible evidence.
What is Goodhart’s Law?
What is Campbell’s Law?